
Facebook Stock Technical Analysis today at $501.53. If the price falls and reaches the 494.94 area, it will head to the first support area at 484.62. If the downside continues, it will head to the second support area at 475.45.
On the other hand,
if the price rises and stabilizes above the 494.94 area, it will head to the first resistance area at 513.68 and the second resistance area at 522.09.
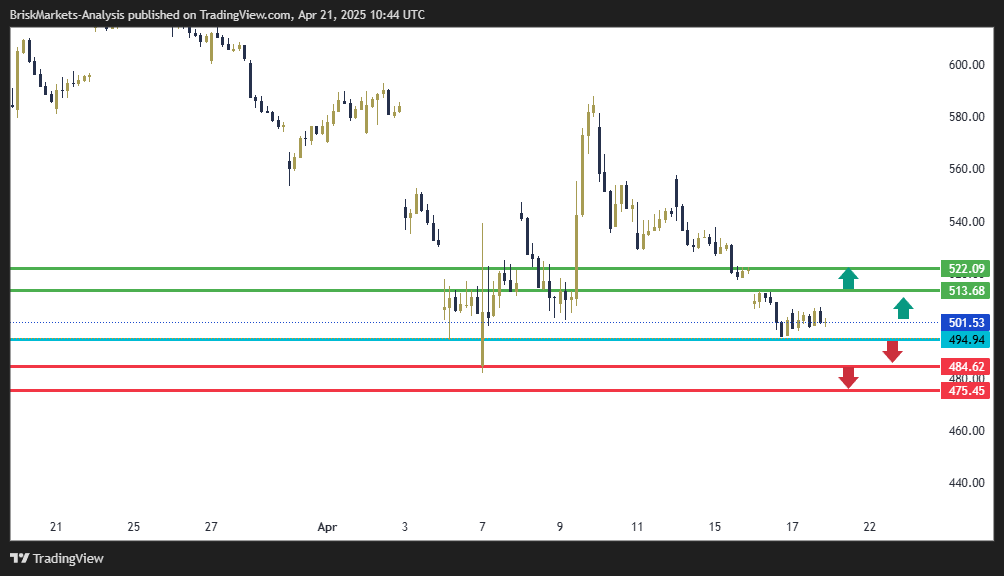
Facebook Stock Technical Analysis: Resistance and Support Levels
• Resistance Second: 522.09
• First resistance: 513.68
• First support: 484.62
• Second support: 475.45


