
NAS100 NDX Technical Analysis is trading at the $17924 area. According to technical analysis, the current trend is a downward trend in the American index prices. The price of the American index appears below most of the crossings of the moving averages, and the MACD indicator also shows negative signs.
Accordingly, we expect the index to take a downward trend, so we will sell from the drop to the 17873 level, and we will also target the $17795 level as a profit-taking target. To ensure risk control, it is recommended to set a stop loss point at the $18053 area.
NAS100 NDX Technical Analysis: on the other hand
In case the buy zone at $18053 is broken, targeting additional support level at $18104 could be achieved.
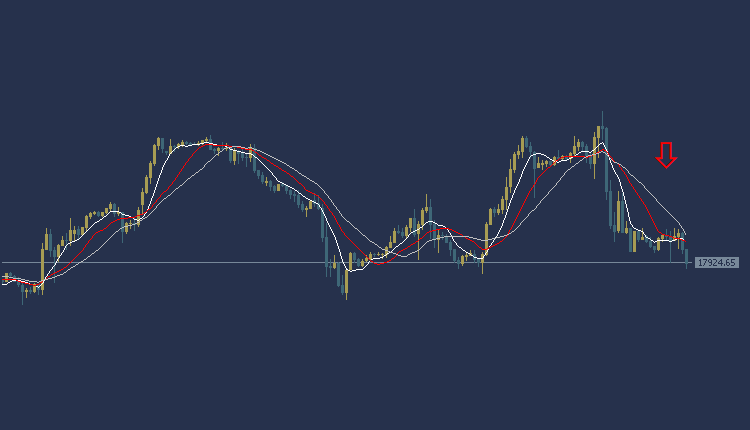
NAS100 NDX Technical Analysis: resistance and support
- Second resistance: 18010.06
- Initial resistance: 17980.20
- Pivot level: 17950.14
- First support: 17900.70
- Second support: 17876.80
USOIL Technical Analysis: Oil prices decline
USOIL Technical Analysis, in the global oil market, the price is trading at the area of $77.16 per barrel. According to technical analysis, the current trend indicates a downward trend with prices trading below the moving average intersections, and the MACD indicator also shows a negative trend.
Accordingly, selling can fall to the price of 76.67, and we will target $75.88 per barrel as a profit-taking target. To ensure risk control, it is recommended to set a stop loss point at $78.21 per barrel.
USOIL Technical Analysis: On the other side
If the buy zone of 78.21 per barrel is broken, the target will be $78.76 per barrel.
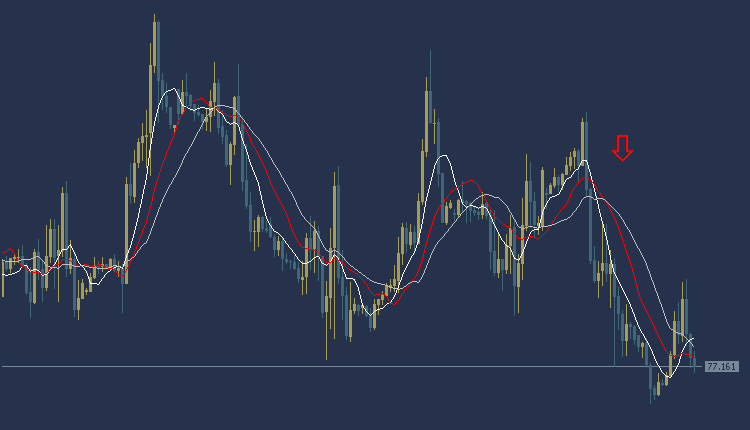
USOIL Technical Analysis: resistance and support levels
- Second resistance: 77.95
- First resistance: 77.62
- Pivot level: 77.20
- First support: 76.76
- Second support: 76.55
EURUSD Technical Analysis: an upward trend
EURUSD Technical Analysis, the Euro/Dollar is in a weak upward trend during the American session. The Euro/Dollar is trading at $1.0941, where prices appear to be trading above most of the moving average intersections shown on the chart. The MACD indicator also indicates a positive trend and, accordingly, we can look to buy from the rise to the price of $1.0952, and the target could be the $1.0970 area. It is also recommended to choose the $1.0918 area as a stop loss point to control risk.
EURUSD Technical Analysis: On the other hand
On the other hand, if the $1.0918 sell area is broken, the target is $1.0903.
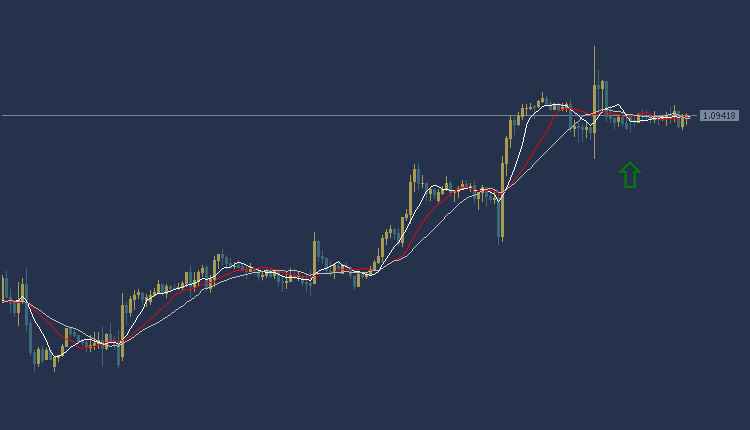
EURUSD Technical Analysis: resistance and support levels
- Second resistance: 1.0957
- First resistance: 1.0948
- Pivot level: 1.0943
- First support: 1.0936
- Second support: 1.0925
NZDUSD Technical Analysis: bullish trading
NZDUSD Technical Analysis: The New Zealand Dollar is trading today in an upward trend during the American session, as the price of the New Zealand Dollar is trading at 0.6173, and trading appears above most of the moving average intersections. The MACD indicator also indicates positive signals
Accordingly, we can look to buy from the rise to the price of 0.6181, and the targeted target could be the 0.6195 area. It is also recommended to choose the 0.6153 area as a stop loss point to control risk.
NZDUSD Technical Analysis: On the other hand
On the other hand, if the selling zone at 0.6153 is broken, the New Zealand price may head towards the 0.6142 level.
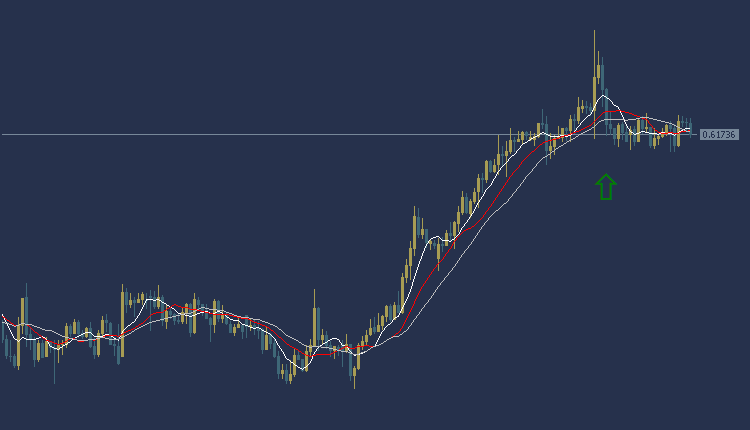
NZDUSD Technical Analysis: Resistance and Support:
- Second resistance: 0.6191
- First resistance: 0.6187
- Pivot level: 0.6176
- First support: 0.6167
- Second support: 0.6160


