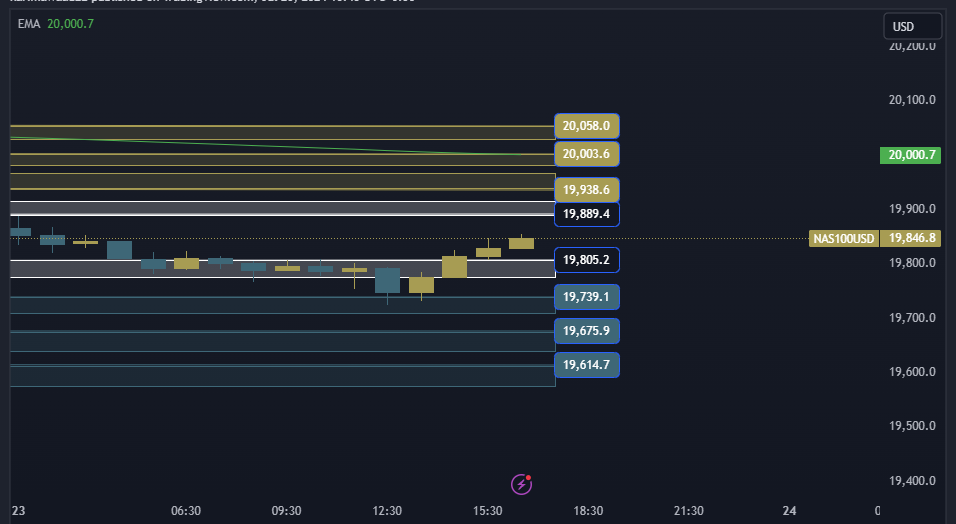
NAS100 NDX Technical Analysis is trading at the $19889/19805 area. In the event of an ascent and stability above the 19889 area, it will head to the first resistance area at 19938, and if the ascent is completed, it will head to the 20003/20058 areas.
NAS100 NDX Technical Analysis On the other side
In the event of a decline and stability below the 19805 area, it will head to the first support area at 19739, and in the event of a complete decline, it will head to the 19614/19675 areas.
NAS100 NDX Technical Analysis: support and resistance levels
• Third resistance: 20058
• Second resistance: 20003
• First resistance: 19938
• Trading area: 19889/19805
• First support: 19739
• Second support: 19675
• Third support: 19614