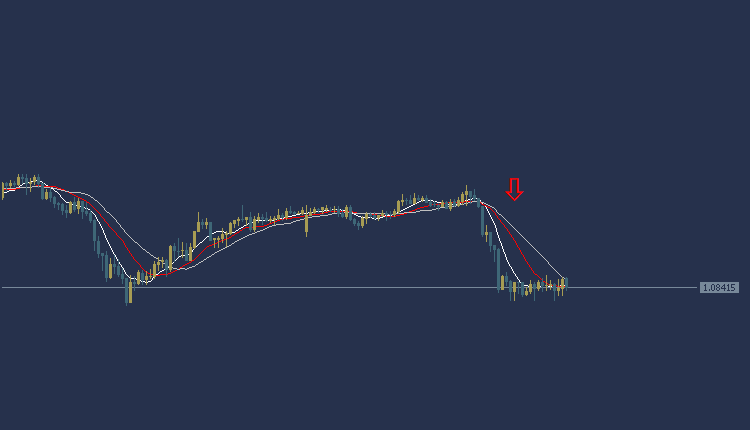
EURUSD Technical Analysis: The Euro/Dollar is in a general bearish trend today during the American session. The euro/dollar is trading at the 1.0837/$1.0844 area, and indicators point to a downward trend. Accordingly, stability below the 1.0833 area will head to the first support at 1.0830, and if the decline is completed, it will head to the second support area at 1.0821.
EURUSD Technical Analysis: On the other hand
In the event of an ascent and stability, trading above the 1.0844 area will head to the first resistance area at 1.0850, and if the ascent continues, it will head to the second resistance area at 1.0859.

EURUSD Technical Analysis: resistance and support levels
- Trading area: 1.0837/1.0844
- First support: 1.0830
- Second support: 1.0821
- First resistance: 1.0850
- Second resistance: 1.0859
Gold Technical Analysis: a general upward trend
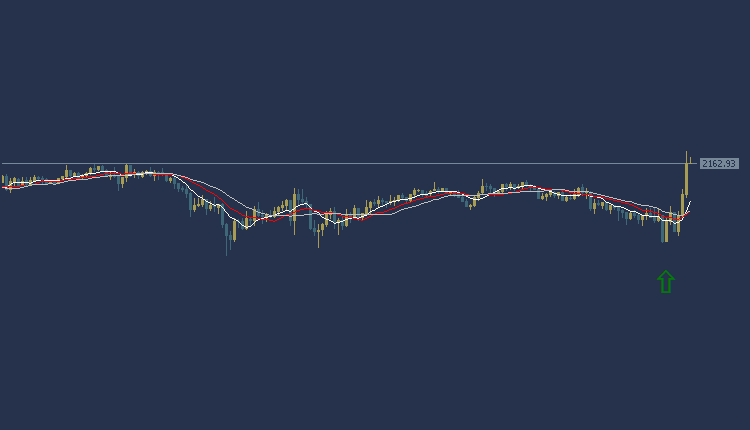
Gold Technical Analysis: The price of gold today is trading at the area of 2151/2156 dollars per ounce. Trading appears in an upward trend, and the indicators indicate an upward trend. If the rise continues above the 2156 area, it will head to the first resistance area at 2170, and if the rise is completed, it will head to the second resistance area. At 2177
Gold Technical Analysis: On the other hand
In the event of a decline and stability below the 2151 area, it will head to the initial support area at 2145, and in the event of a complete decline, it will head to the 2139 area.

Gold Technical Analysis: resistance and support levels
- Trading area: 2151/2156
- Initial resistance: 2170
- Second resistance: 2177
- First support: 2145
- Second support: 2139
USOIL Technical Analysis: Oil prices fall
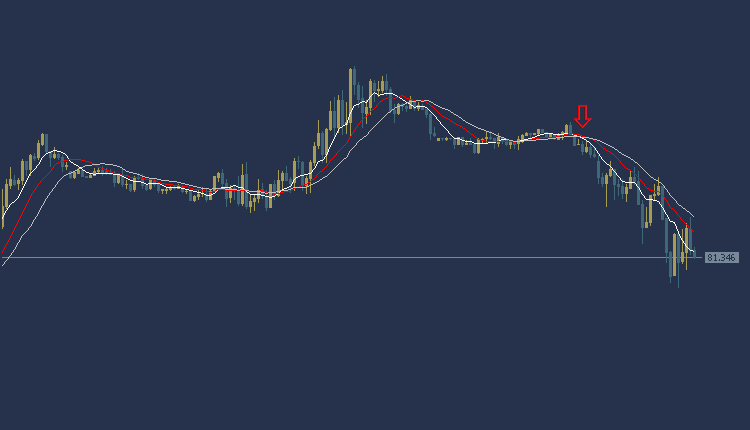
USOIL Technical Analysis, trading at $81.28/81.54 per barrel. According to technical analysis, the indicators point to a downward trend, and in the event of stability below the 81.28 area, it will head to the first support area at 81.28, and if the decline is completed, it will head to the second support area at 80.69.
USOIL Technical Analysis: On the other side
In the event of an ascent and stability, trading above the 81.54 area will head to the first resistance area at 82.02, and if the rise continues, it will head to the second resistance area at 82.42.

USOIL Technical Analysis: resistance and support levels
- Trading area: 81.28/81.54
- First support: 81.28
- Second support: 80.69
- First resistance: 82.02
- Second resistance: 82.42


