
EURUSD Technical Analysis, the Euro/Dollar is trading in a bearish trend during the European session. The euro is trading at $1.0926, and as the chart shows, trading is below most of the moving average intersections. The MACD indicator also indicates a negative trend indicating the presence of selling power.
Accordingly, we can carry out a selling operation waiting for the price to fall at the level of $1.0918, and the target could be the $1.0899 area. It is also recommended to choose the $1.0935 area as a stop loss point to control risks.
EURUSD Technical Analysis: On the other hand
EURUSD Technical Analysis On the other hand, if the stop loss area at $1.0935 is broken, the euro price may head towards the $1.0952 level.
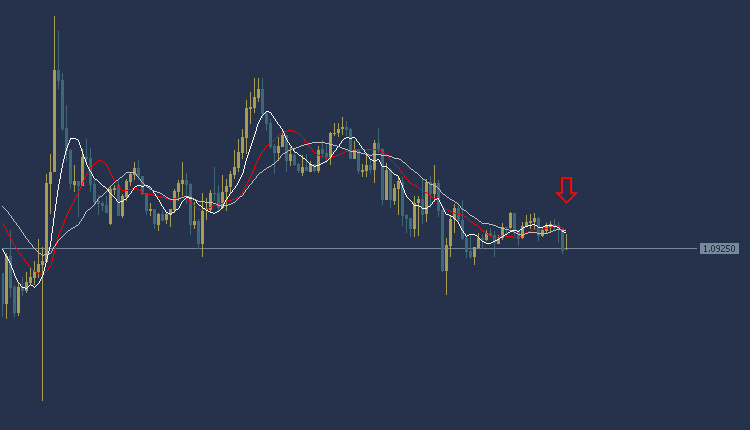
EURUSD Technical Analysis: resistance and support levels
• Second resistance: 1.0937
• First resistance: 1.0930
• Pivot level: 1.0927
• First support: 1.0920
• Second support: 1.0917
GBPUSD Technical Analysis: It is trading in a downward trend
GBPUSD Technical Analysis, the pound dollar is trading in a bearish direction during the European session. The pound is trading at $1.2699, and as the chart shows, the pound is trading below the intersections of the moving averages. The MACD indicator also indicates a negative trend indicating a weakness in selling power.
Accordingly, we can carry out a selling operation, waiting for the price to fall to the $1.2687 area, and the target could be the $1.2663 area. It is also recommended to choose the $1.2713 area as a stop loss point to control risks.
GBPUSD Technical Analysis: On the other hand
GBPUSD Technical Analysis On the other hand, if the stop loss area at $1.2713 is broken, the pound price may head towards the $1.2737 level.

GBPUSD Technical Analysis: resistance and support levels
• Second resistance: 1.2676
• First resistance: 1.2682
• Pivot level: 1.2692
• First support: 1.2698
• Second support: 1.2708
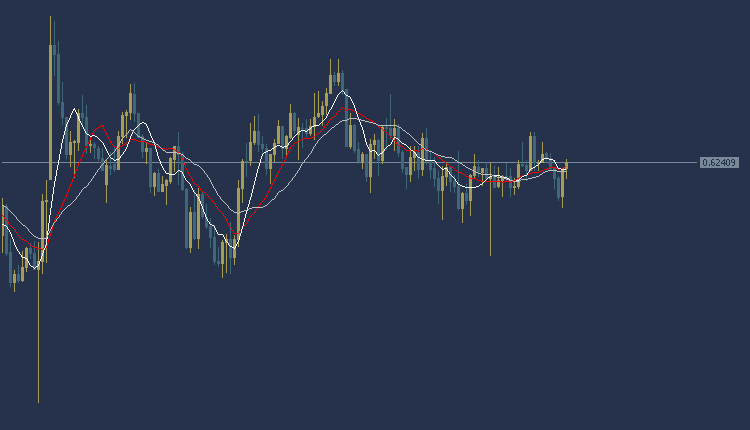
NZDUSD Technical Analysis: It trades in a sideways direction
NZDUSD the New Zealand dollar are trading in a sideways trend today during the European session. We advise against trading the New Zealand dollar until clear signals confirm the trend
Gold Technical Analysis : today’s gold price
Gold Technical Analysis, the price of gold today against the dollar during the European session takes a sideways trend. We advise against trading until clear signals confirm the trend.


