
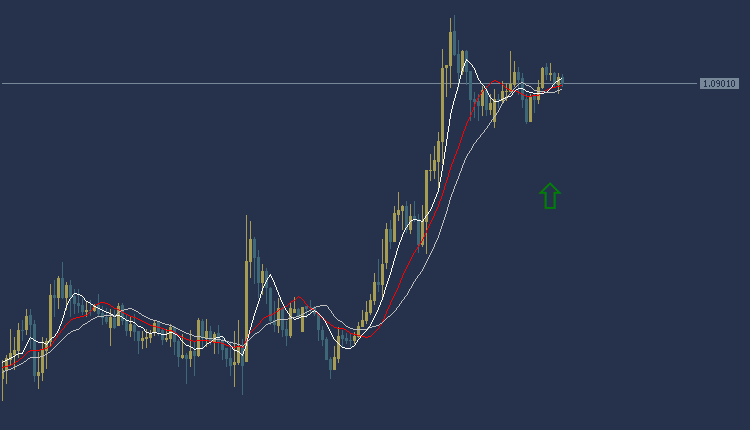
EURUSD Technical Analysis, The EUR/USD is trading in an upward trend today during the European session. The euro is trading at $1.0900, and as the chart shows, it is trading above most of the moving average intersections. The MACD indicator also indicates a positive trend indicating the emergence of buying power.
Accordingly, we can make a purchase if the Euro/Dollar price breaks at the $ 1.0915 level, and the target could be the 1.0940 area. It is also recommended to choose the $1.0885 area as a stop loss point to control risks.
EURUSD Technical Analysis: On the other hand
On the other hand, if the support area at $1.0885 is broken, the euro price may head towards the $1.0865 level.
EURUSD Technical Analysis: resistance and support levels
• Second resistance: 1.0909
• First resistance: 1.0905
• Pivot level: 1.0902
• First support: 1.0898
• Second support: 1.0895
GBPUSD Technical Analysis: It is trading in an upward trend
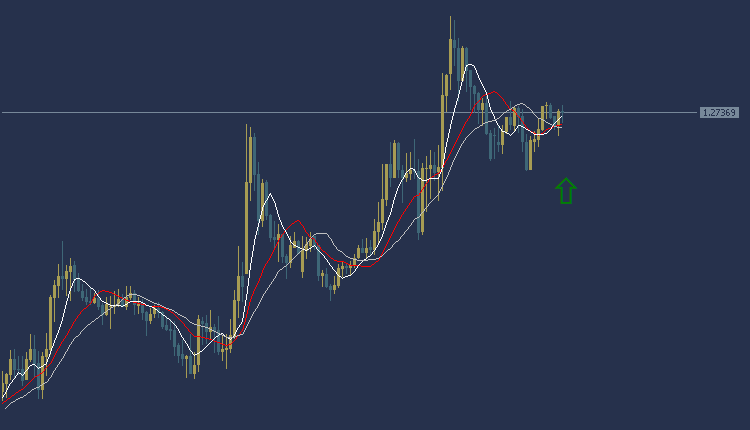
GBPUSD Technical Analysis, the pound dollar is trading in an upward trend today during the European session. The pound is trading at $1.2736, as shown in the chart shown above most of the moving average intersections. The MACD indicator also indicates a positive trend indicating a weakness in buying power.
Accordingly, we can make a purchase if the price of the pound/dollar pair breaks the $1.2745 area, and the target could be the $1.2760 area. It is also recommended to choose the $1.2715 area as a stop loss point to control risk.
GBPUSD Technical Analysis: On the other hand
On the other hand, if the support area at $1.2715 is broken, the pound price may head towards the $1.2685 level.
GBPUSD analysis: resistance and support levels
• Second resistance: 1.2711
• First resistance: 1.2708
• Pivot level: 1.2705
• First support: 1.2702
• Second support: 1.2699
Gold Technical Analysis: gold price today
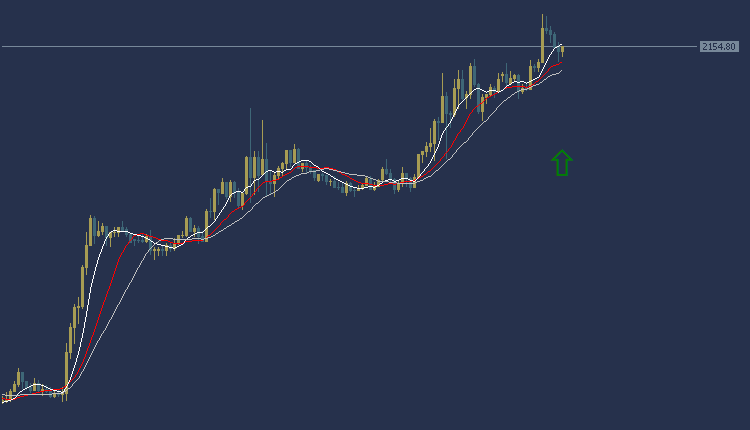
Technical analysis of gold, the price of gold today against the dollar during the European session is in a general upward trend. Gold is trading at $2154 per ounce, and trading appears above most of the moving average intersections, as shown in the chart. The MACD indicator also indicates a positive trend indicating the presence of buying power.
Accordingly, we can buy while waiting for the price of the yellow metal, gold, to rise to the area of $2157 per ounce, and the target could be the area of $2161 per ounce. It is also recommended to choose the $2151 per ounce area as a stop loss point to control risks.
Gold Technical Analysis: On the other hand
On the other hand, if the support area at $2151 per ounce is broken, the gold price may head towards the $2148 per ounce level.
Gold Technical Analysis: resistance and support levels
• Second resistance: 2137.42
• First resistance: 2136.44
• Pivot level: 2134.77
• First support: 2133.79
• Second support: 2132.12


