
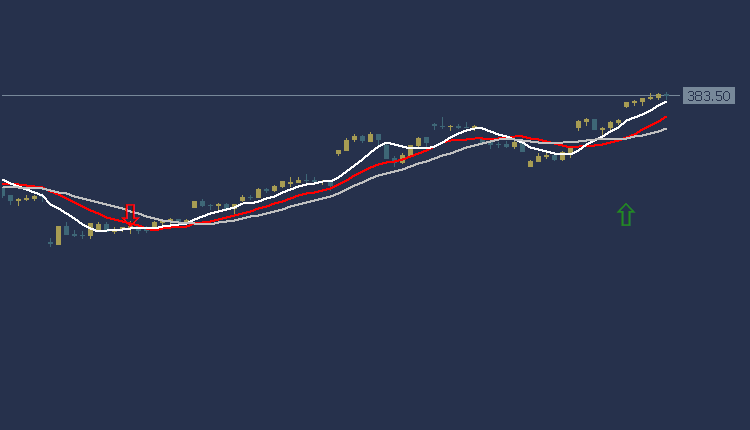
Facebook Stock Technical Analysis Today, Facebook stock is trading today in the American stock market at $383.24 per share. According to technical analysis, the current trend indicates an upward trend in Facebook share prices. Facebook’s share price reflects upward strength by exceeding most of the moving average intersections, and the MACD indicator also shows positive signs, with strength to buy.
Accordingly, we expect the price of Facebook shares to fall, so we can buy, waiting for the price to rise at the level of $393.47 per share to enter the purchase process, and we target the level of $410.08 per share as a profit-taking target. To ensure risk control, it is recommended to set the stop loss point at $365.71 per share.
Facebook Stock Technical Analysis: on the other hand
If the stop loss area at $365.71 per share is broken, the additional target level at $349.37 per share can be achieved.
Facebook Stock Technical Analysis: Resistance and Support Levels
Second resistance: 405.00
First resistance: 400.00
Pivot level: 383.24
First support: 360.00
Second support: 350.00
Dow Jones US30 Technical Analysis: It is trading in an upward trend
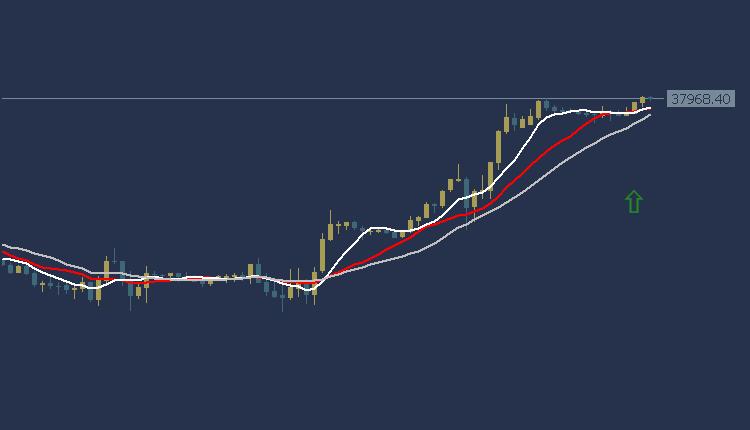
Dow Jones US30 Technical Analysis Today, the Dow Jones Index is trading at the $37,947 area. According to technical analysis, the current trend is an upward trend in the American index prices. The price of the American index appears above most of the moving average intersections, and the MACD indicator also shows positive signs
Accordingly, we expect the index to take an upward trend, so we will buy from the level of 38104, and we will also target the level of $38342 as a profit-taking target. To ensure risk control, it is recommended to set a stop loss point at the $37,763 area.
Dow Jones US30 Technical Analysis: On the other hand
If the stop loss area at $37,763 is broken, targeting the additional level at $37,542 could be achieved.
Dow Jones US30 Technical Analysis: resistance and support levels
• Second resistance: 37921.70
• Initial resistance: 37887.23
• Pivot level: 37858.60
• First support: 37824.13
• Second support: 37795.50
USOIL Technical Analysis: It is trading in a general bearish trend
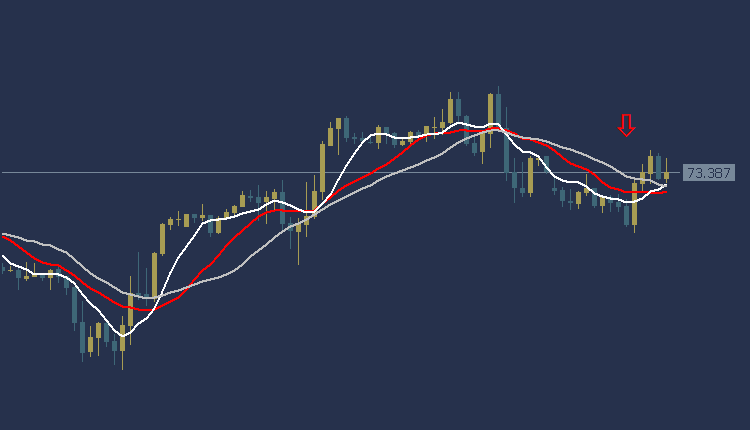
USOIL Technical Analysis Today, we find the price of oil trading at $73.09 per barrel. Based on current technical analysis, the current trend shows a bearish trend in oil prices. The strength of this trend indicates a clear decline in the price of oil, as it traded below most of the intersections of the moving averages. In addition, the MACD indicator provides strength signals to sell.
Based on this analysis, we will wait for oil to fall to the target level of $72.41 per barrel, while choosing $71.72 as the target to take profits. It is necessary to set the stop loss point at the $73.78 area
USOIL Technical Analysis: on the other hand
If the stop loss area at $73.78 per barrel is broken, the oil price could head towards the additional level at $74.33 per barrel.
USOIL Technical Analysis: resistance and support levels
• Second resistance: 73.80
• First resistance: 73.57
• Pivot level: 73.45
• First support: 73.22
• Second support: 73.10
EURUSD Technical Analysis: Trading in a upward trend
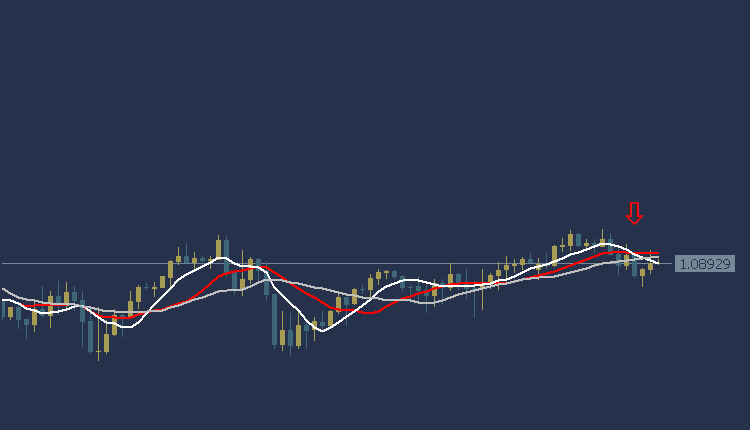
EURUSD Technical Analysis Today, the EUR/USD is trading in a upward trend during the American session. The euro/dollar is trading at $1.0891, and trading appears below most of the moving average intersections. The MACD To the emergence of a weak negative trend and the emergence of strength to sell
Accordingly, we sell from the price of $1.0872, and the target target could be the $1.0844 area.
It is also recommended to choose the $1.0905 area as a stop loss point to control risk.
EURUSD Technical Analysis: On the other hand
If the stop loss area at $1.0905 is breached, the euro price may head towards the $1.0934 level.
EURUSD Technical Analysis: resistance and support levels
• Second resistance: 1.0895
• First resistance: 1.0892
• Pivot level: 1.0887
• First support: 1.0884
• Second support: 1.0879


