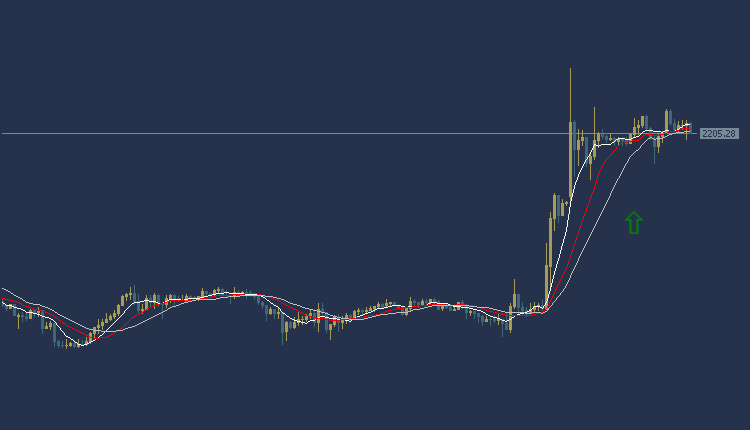
Gold Technical Analysis: The price of gold today is trading in a general upward trend during the American session. The Gold is trading at the $2200/2208 area, and the indicators indicate an upward trend. Accordingly, in the event of an ascent and stability above the 2208 area, it will head to the first resistance at 2214, and in the event of completion of the ascent, it will head to the second resistance area at 2220.
Gold Technical Analysis: On the other hand
In the event of a decline and stability in trading below the 2200 area, it will head to the first support area at 2192, and if it continues to rise, it will head to the second support area at 2188.

Gold Technical Analysis: resistance and support levels
- Trading area: 2200/2208
- First resistance: 2214
- Second resistance: 2220
- First support: 2192
- Second support: 2188
NAS100 NDX Technical Analysis: Overall trend is bullish
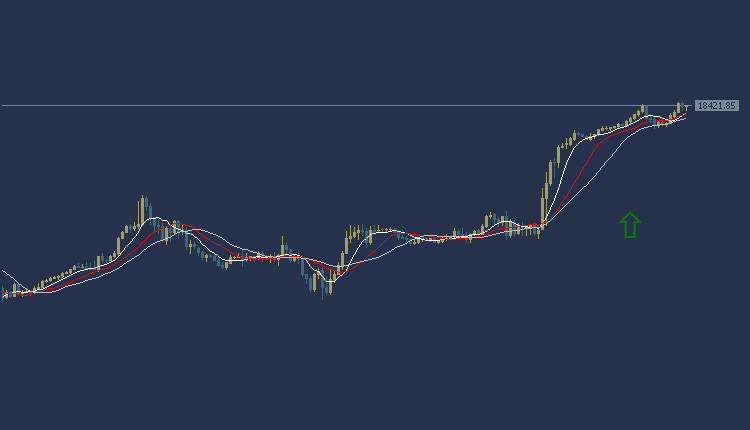
NAS100 NDX Technical Analysis Today, the Nasdaq is trading in a general upward trend during the American session. The Nasdaq is trading at the $18,359/$18,430 area, and the indicators point to an upward trend, and accordingly, in the event of an ascent and stability above the 18,430 area, it will head to the first resistance at 18,480, and in the event of completion of the ascent, it will head to the second resistance area at 18,530.
NAS100 NDX Technical Analysis: On the other hand
In the event of a decline and stability in trading below the 18359 area, it will head to the first support area at 18309, and if it continues to rise, it will head to the second support area at 18259.

NAS100 NDX Technical Analysis resistance and support
- Trading area: 18359/18430
- First resistance: 18480
- Second resistance: 18530
- First support: 18309
- Second support: 18259
GBPUSD Technical Analysis: Bearish trading
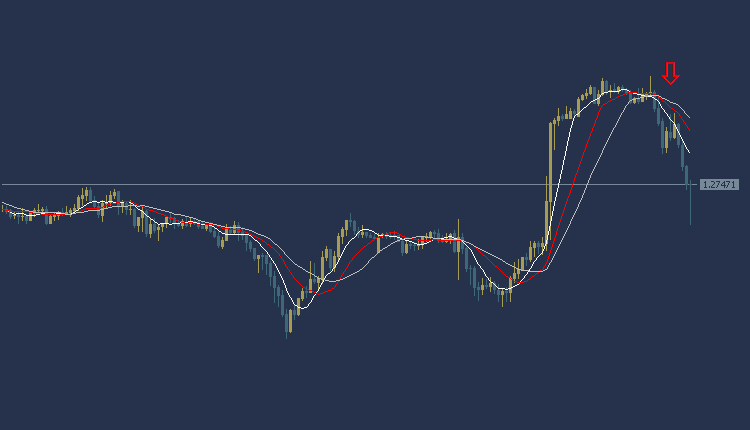
Technical analysis of the pound dollar today is in a general bearish trend during the American session. The pound dollar is trading at the 1.2729/$1.2753 area, and the indicators indicate a downward trend. Accordingly, stability below the 1.2729 area will head to the first support at 1.2710, and in the event that the decline is completed, it will head to the second support area at 1.2688.
GBPUSD Technical Analysis: on the other side
In the event of a rise and stability, trading above the 1.2753 area will head to the first resistance area at 1.2769, and if the rise continues, it will head to the second resistance area at 1.2782.

GBPUSD Technical Analysis: resistance and support levels
- Trading area: 1.2729/1.2753
- First support: 1.2710
- Second support: 1.2688
- First resistance: 1.2769
- Second resistance: 1.2782
NZDUSD Technical Analysis: bearish trend
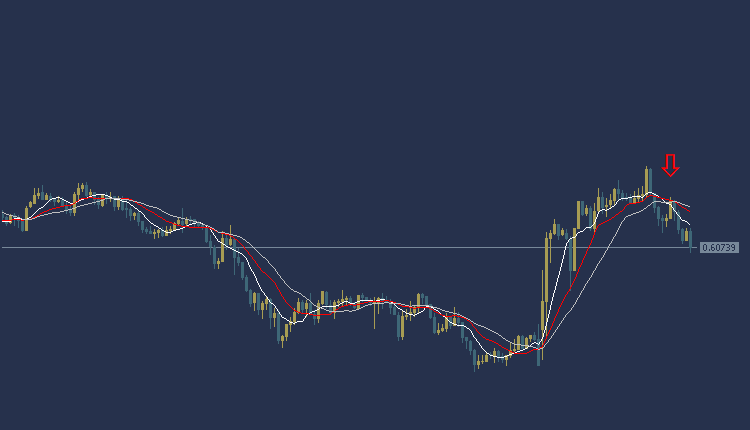
NZDUSD Technical Analysis: The New Zealand Dollar is trading in a bearish trend today during the American session. The New Zealand dollar is trading at the 0.6064/0.6081 area, and the indicators indicate a downward trend. Accordingly, stability below the 0.6064 area will head to the first support at 0.6044, and in the event that the decline is completed, it will head to the second support area at 0.6020.
NZDUSD Technical Analysis: On the other hand
In the event of an ascent and stability, trading above the 0.6081 area will head to the first resistance area at 0.6095, and if the rise continues, it will head to the second resistance area at 0.6120.

NZDUSD Technical Analysis Resistance and Support:
- Trading area: 0.6064 / 0.6081
- First support: 0.6044
- Second support: 0.6020
- First resistance: 0.6095
- Second resistance: 0.6120


