
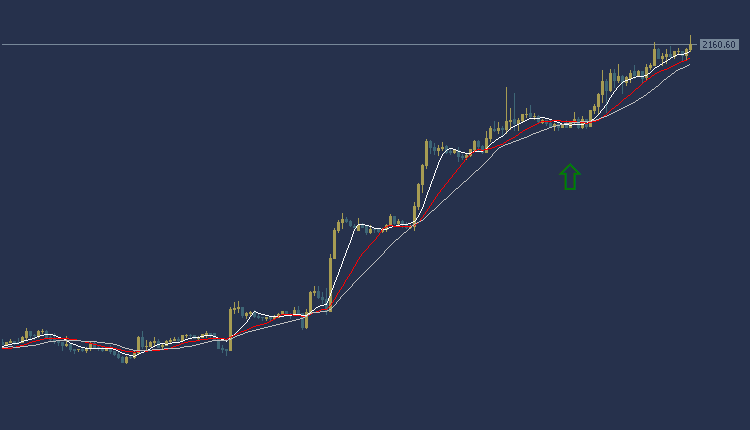
Gold Technical Analysis: The price of gold is trading today at $2160 per ounce. Trading appears in an upward trend, as the price of gold is trading above the intersections of the Moving Average indicators. As for the MACD indicator, it indicates positive signals.
Accordingly, we can look to buy from the rise to the price of $2169 per ounce, and target the $2178 per ounce area to take profits, while setting the $2130 per ounce area as a stop loss.
Gold Technical Analysis: On the other hand
On the other hand, if the $2130 per ounce selling area is broken, the price may head to the $2118 per ounce area.
Gold Technical Analysis: resistance and support levels
- Second resistance: 2163.05
- First resistance: 2162.55
- Pivot level: 2160.86
- First support: 2158.80
- Second support: 2156.79
EURUSD Technical Analysis: an upward trend
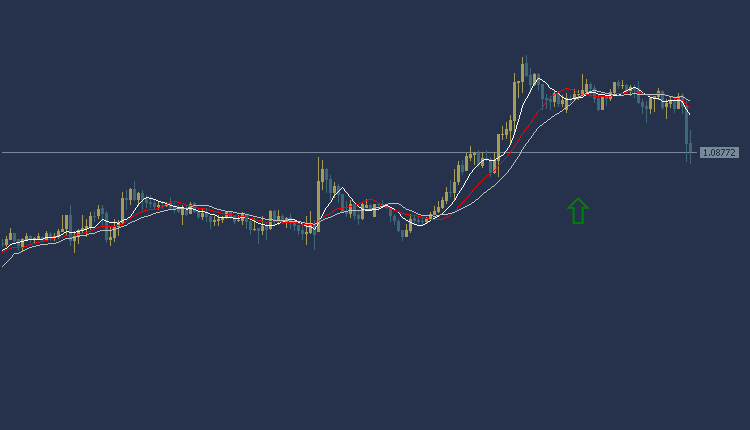
EURUSD Technical Analysis, the Euro/Dollar is in a weak upward trend during the American session. The Euro/Dollar is trading at $1.0877, where prices appear to trade below most of the moving average intersections shown on the chart. The MACD indicator also indicates a weak positive trend and, accordingly, we can look to buy from the rise to the price of $1.0886, and the target could be the $1.0899 area. It is also recommended to choose the $1.0858 area as a stop loss point to control risk.
EURUSD Technical Analysis: On the other hand
On the other hand, if the $1.0858 sell area is broken, the target is $1.0847.
EURUSD Technical Analysis: resistance and support levels
- Second resistance: 1.0895
- First resistance: 1.0888
- Pivot level: 1.0880
- First support: 1.0872
- Second support: 1.0863
USOIL Technical Analysis: Oil prices decline
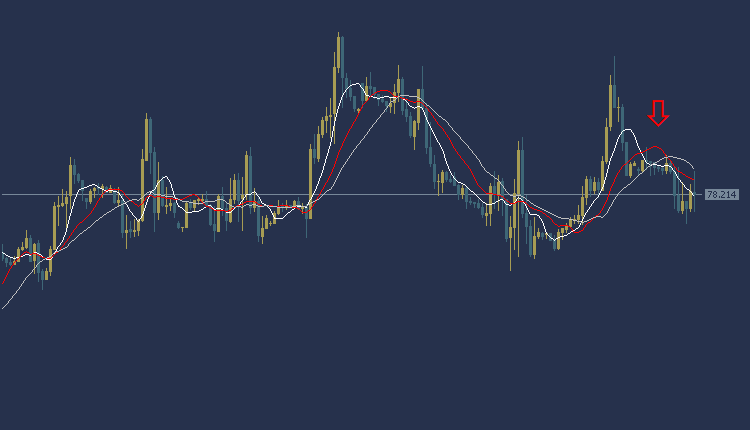
USOIL Technical Analysis, in the global oil market, the price is trading at the area of $78.21 per barrel. According to technical analysis, the current trend indicates a downward trend with prices trading below the moving average intersections, and the MACD indicator also shows a negative trend.
Accordingly, selling can fall to the price of 77.85, and we will target $77.35 per barrel as a profit-taking target. To ensure risk control, it is recommended to set the stop loss point at the $78.85 per barrel area.
USOIL Technical Analysis: On the other side
If the buy zone of 78.85 per barrel is broken, the target will be $79.15 per barrel.
USOIL Technical Analysis: resistance and support levels
- Second resistance: 78.82
- First resistance: 78.62
- Pivot level: 78.30
- First support: 78.00
- Second support: 77.76
Facebook Stock Technical Analysis: is trading in an upward trend
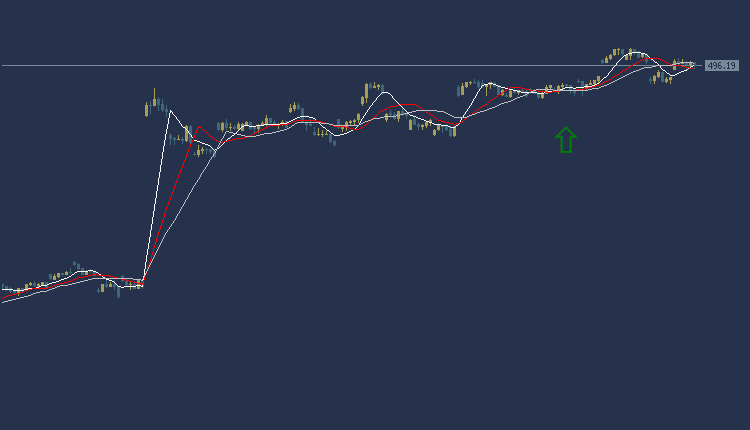
Facebook Stock Technical Analysis, Facebook shares are trading today in the American stock market at $496.19 per share. According to technical analysis, the current trend indicates an upward trend in Facebook share prices. Facebook share price reflects trading above most of the moving average intersections, and the MACD indicator is showing positive signs
Based on this, we expect the price of Facebook shares to rise, so we can buy and wait for the price to rise at the level of $500.91 per share to enter the purchase process, and we target the level of $510.86 per share as a profit-taking target. To ensure risk control, it is recommended to set the stop loss point at $482.57 per share.
Facebook Stock Technical Analysis: On the other hand
If the stop loss area at $482.57 per share is broken, targeting the level of $472.22 per share can be achieved.
Facebook Stock Technical Analysis: Resistance and Support Levels
- Second resistance: 468.02
- First resistance: 467.10
- Pivot level: 496.55
- First support: 495.55
- Second support: 494.46


