
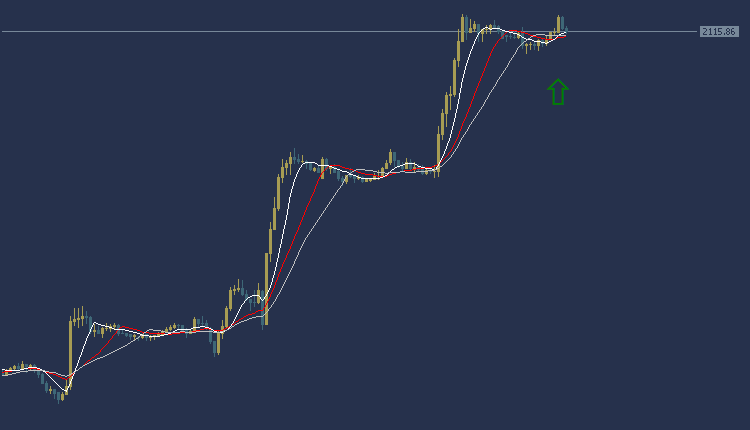
Gold Technical Analysis, the price of gold today against the dollar during the European session is in a general upward trend. Gold is trading at $2115 per ounce, and trading appears above most of the moving average intersections, as shown in the chart. The MACD indicator also indicates a positive trend indicating the presence of buying power.
Accordingly, we can buy while waiting for the price of the yellow metal, gold, to rise to the area of $2118 per ounce, and the target could be the area of $2121 per ounce. It is also recommended to choose the $2112 per ounce area as a stop loss point to control risks.
Gold Technical Analysis: On the other hand
On the other hand, if the support area at $2112 per ounce is broken, the gold price may head towards the $2109 per ounce level.
Gold Technical Analysis: resistance and support levels
• Second resistance: 2130.87
• First resistance: 2129.19
• Pivot level: 2126.27
• First support: 2124.59
• Second support: 2121.67
EURUSD Technical Analysis: trading in a trend
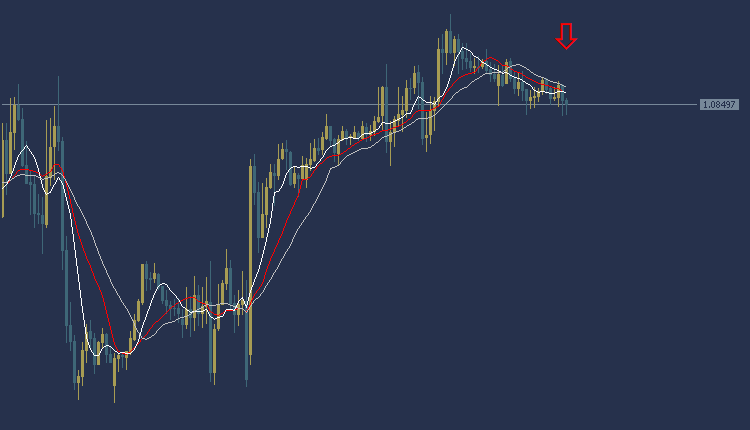
EURUSD Technical Analysis, The EUR/USD is trading in a bearish trend today during the European session. The euro is trading at $1.0848, and as the chart shows, trading is below most of the moving average intersections. The MACD indicator also indicates a positive trend indicating a weakness in buying power.
Accordingly, we can carry out a selling operation if the Euro/Dollar price breaks at the level of $1.0838, and the target could be the $1.0800 area. It is also recommended to choose the $1.0850 area as a stop loss point to control risks.
EURUSD Technical Analysis: On the other hand
On the other hand, if the resistance area at $1.0850 is broken, the euro price may head towards the $1.0880 level.
EURUSD Technical Analysis: resistance and support levels
• Second resistance: 1.0858
• First resistance: 1.0855
• Pivot level: 1.0852
• First support: 1.0849
• Second support: 1.0846
GBPUSD Technical Analysis: It is trading in a downward trend
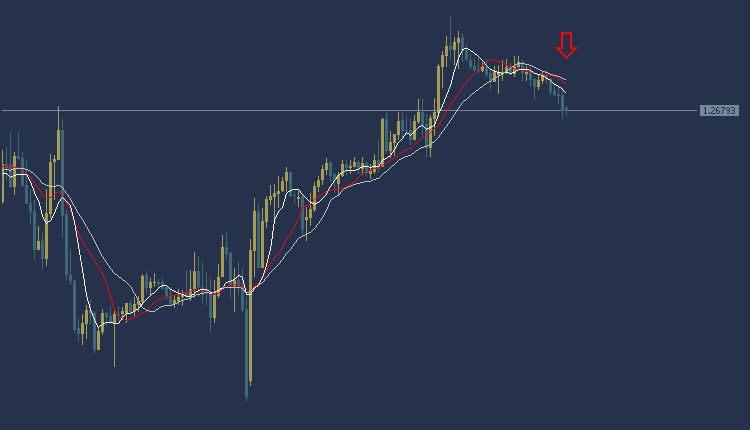
GBPUSD Technical Analysis ,The pound dollar is trading in a bearish trend today during the European session. The pound is trading at $1.2679, as shown in the chart shown below most of the moving average intersections. The MACD indicator also indicates a positive trend indicating a weakness in buying power.
Accordingly, we can carry out a selling operation if the price of the pound/dollar pair breaks the $1.2660 area, and the target could be the $1.2630 area. It is also recommended to choose the $1.2690 area as a stop loss point to control risk.
GBPUSD Technical Analysis: On the other hand
On the other hand, if the resistance area at $1.2690 is broken, the pound price may head towards the $1.2720 level.
GBPUSD Technical Analysis: resistance and support levels
• Second resistance: 1.2690
• First resistance: 1.2687
• Pivot level: 1.2684
• First support: 1.2681
• Second support: 1.2678


