
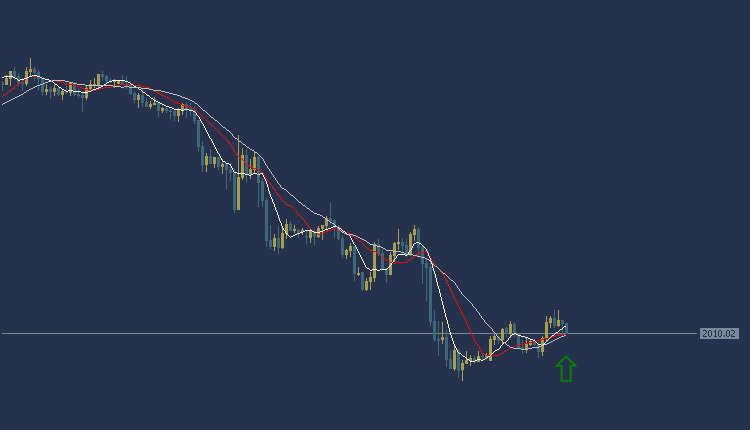
Gold Technical Analysis, the price of gold today against the dollar during the European session is in a general bearish trend. Gold is trading at a price of $2010 per ounce, and trading shows weakness in most of the moving average intersections, as shown in the chart. The MACD indicator also indicates a negative trend indicating a weakness in selling power.
Accordingly, we can buy while waiting for the price of the yellow metal, gold, to rise to the region of $2014 per ounce, and the target could be the region of $2020 per ounce. It is also advisable to choose the $2005 per ounce area as a stop loss point to control risk.
Gold Technical Analysis XAUUSD: On the other hand
On the other hand, if the stop loss area at $2005 per ounce is broken, the gold price may head towards the $1999 per ounce level.
Gold Technical Analysis XAUUSD: resistance and support levels
• Second resistance: 2017.27
• First resistance: 2015.69
• Pivot level: 2014.22
• First support: 2012.64
• Second support: 2011.17
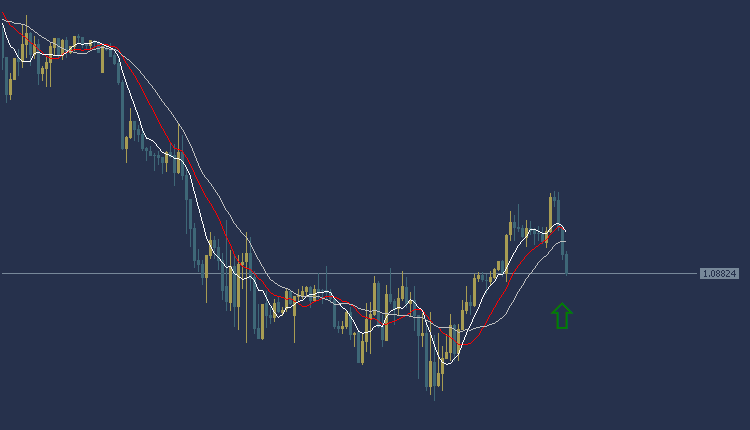
EURUSD Technical Analysis: It is trading in an upward trend
EURUSD Technical Analysis, the EUR/USD is trading in an upward trend during the European session. The euro is trading at $1.0892, and as the chart shows, it is trading above most of the moving average intersections. The MACD indicator also indicates a positive trend indicating a weakness in buying power.
Accordingly, we can make a purchase while waiting for the price to rise at the level of $1.0906, and the target could be the $1.0928 area. It is also recommended to choose the $1.0879 area as a stop loss point to control risk.
EURUSD Technical Analysis: On the other hand
EUR/USD Analysis: On the other hand, if the stop loss area at $1.0879 is broken, the euro price may head towards the $1.0855 level.
EURUSD Technical Analysis: resistance and support levels
• Second resistance: 1.0915
• First resistance: 1.0910
• Pivot level: 1.0902
• First support: 1.0897
• Second support: 1.0889
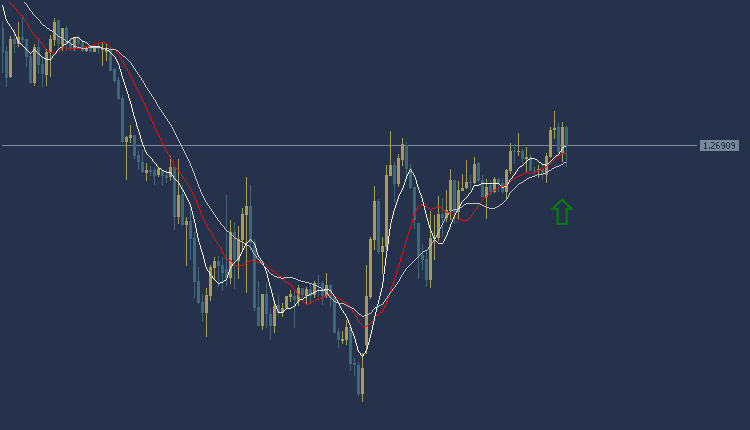
GBPUSD Technical Analysis: It is trading in an upward trend
GBPUSD Technical Analysis ,The pound dollar is trading in an upward trend today during the European session. The pound is trading at $1.2689, and as the chart shows, the pound is trading above the intersections of the moving averages. The MACD indicator also indicates a positive trend indicating the presence of buying power.
Accordingly, we can make a purchase while waiting for the price of the pound-dollar pair to rise to the $1.2703 area, and the target could be the $1.2733 area. It is also recommended to choose the $1.2677 area as a stop loss point to control risks.
GBPUSD Technical Analysis: On the other hand
On the other hand, if the stop loss area at $1.2677 is broken, the pound price may head towards the $1.2644 level.
GBPUSD Technical Analysis: resistance and support levels
• Second resistance: 1.2713
• First resistance: 1.2705
• Pivot level: 1.2696
• First support: 1.2688
• Second support: 1.2679
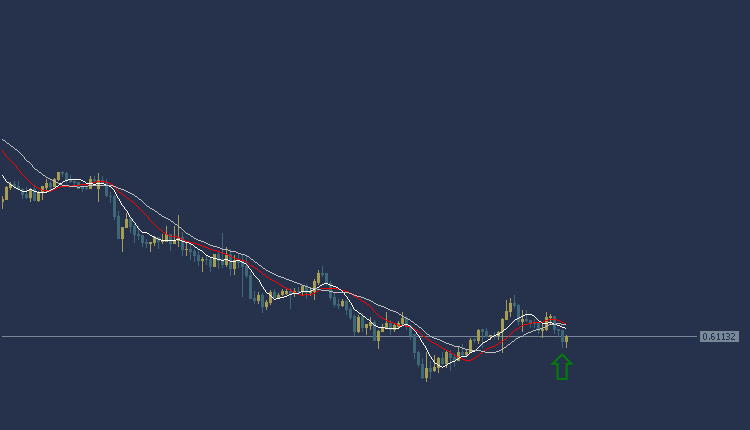
NZDUSD Technical Analysis: The New Zealand Dollar is trading in an upward trend
NZDUSD Technical Analysis,The New Zealand dollar is trading against the US dollar today in a general bearish trend during the European session. The New Zealand dollar is trading at 0.6109, and trading shows weakness at most of the moving average intersections. The MACD indicator also indicates a negative trend indicating a weakness in selling power.
Accordingly, we can consider buying by waiting for the price of the New Zealand Dollar pair to rise and break the resistance at the level of 0.6124, and the target could be the 0.6149 area. It is also recommended to choose the 0.6095 area as a stop loss point to control risks.
NZDUSD Technical Analysis: On the other hand
On the other hand, if the support area or stop loss at 0.6095 is broken, the New Zealand Dollar price may head towards the 0.6070 level.
NZDUSD Technical Analysis: resistance and support levels
• Second resistance: 0.6133
• First resistance: 0.6129
• Pivot level: 0.6123
• First support: 0.6119
• Second support: 0.6113


