
NAS100 NDX Technical Analysis the Nasdaq index is trading at the $18258/18307 area. In the event of a decline and stability below the 18258 area, it will head to the first support area at 18202, and in the event of a complete decline, it will head to the 18134/18065 area.
NAS100 NDX Technical Analysis On the other side
In the event of an ascent and stability above the 18307 area, it will head to the first resistance area at 18373, and in the event that the ascent is completed, it will head to the 18439/18486 areas.
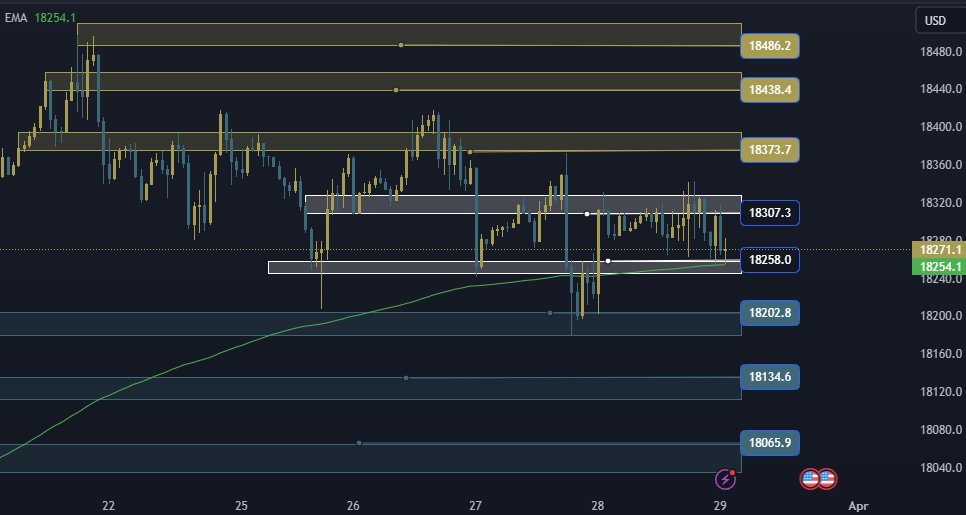
NAS100 NDX Technical Analysis: support and resistance levels
• Trading area: 18258/18307
• First support: 18202
• Second support: 18134
• Third support: 18065
• First resistance: 18373
• Second resistance: 18439
• Third resistance: 18486
Gold Technical Analysis1H:
Gold Technical Analysis Gold is trading at the $2223/2234 area. In the event of an ascent and stability above the 2234 area, it will head to the first resistance area at 2242, and if the ascent is completed, it will head to the second resistance area at 2251.
Gold Technical Analysis On the other side
In the event of a decline and stability below the 2223 area, it will head to the initial support area at 2214, and in the event of a complete decline, it will head to the 2190/2201 areas.
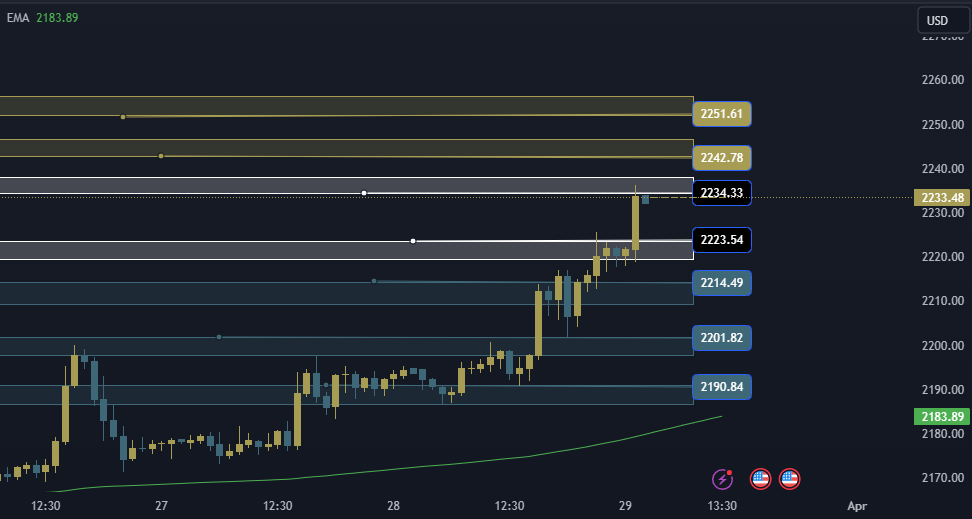
Gold Technical Analysis: support and resistance levels
• Trading area: 2223/2234
• First support: 2214
• Second support: 2201
• Third support: 2190
• First resistance: 2242
• Second resistance: 2251
EURUSD Technical Analysis1H:
The euro/dollar is trading at the 1.07777/$1.07905 area. In the event of a decline and stability below the 1.07777 area, it will head to the first support area at 1.07665, and in the event of a complete decline, it will head to the 1.07488/1.07305 area.
EURUSD Technical Analysis On the other side
In the event of an ascent and stability above the 1.07905 area, it will head to the first resistance area 1.08124, and in the event that the ascent is completed, it will head to the 1.08348/1.08594 areas.
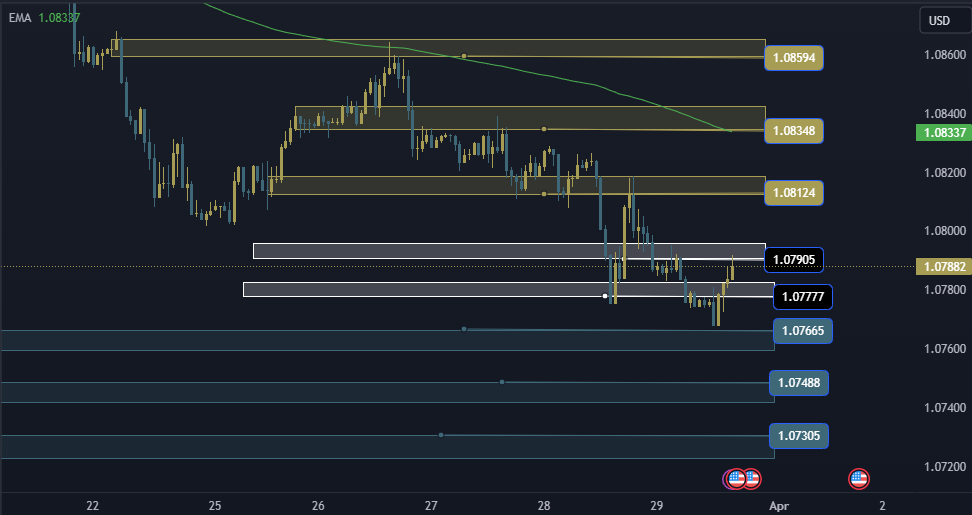
EURUSD Technical Analysis: support and resistance levels
• Trading area: 1.07777/1.07905
• First support: 1.07665
• Second support: 1.07488
• Third support: 1.07305
• First resistance: 1.08124
• Second resistance: 1.08348
• Third resistance: 1.08594
GBPUSD Technical Analysis 1H:
GBPUSD Technical Analysis The pound dollar is trading at the 1.25980/$1.26286 area. In the event of a decline and stability below the 1.25980 area, it will head to the first support area 1.25783, and in the event of a complete decline, it will head to the 1.25515/1.25263 areas.
GBPUSD Technical Analysis On the other side
In the event of an ascent and stability, the highest area 1.26286 will head to the first resistance area 1.26619, and in the event of completion of the ascent, it will head to the 1.26915/1.27235 areas.
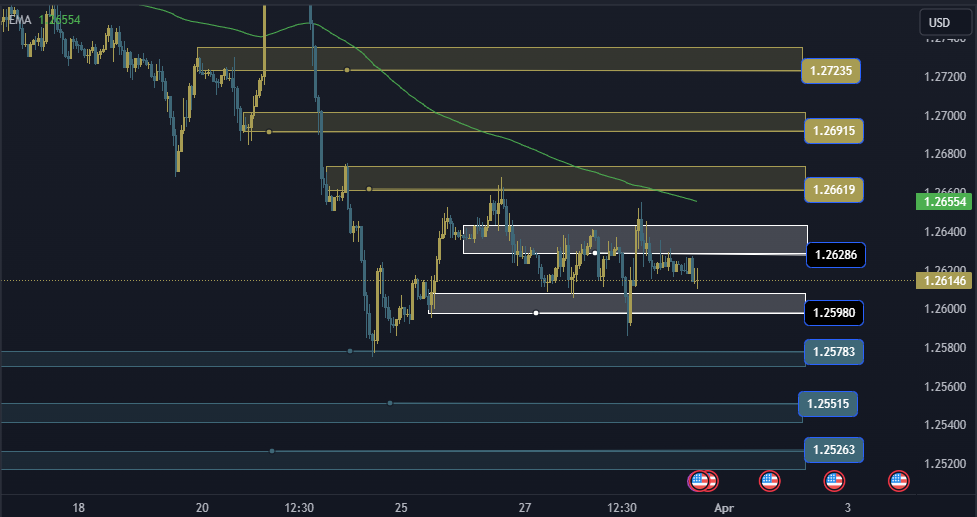
GBPUSD Technical Analysis: resistance and support levels
• Trading area: 1.25980/1.26286
• First support: 1.25783
• Second support: 1.25515
• Third support: 1.25263
• First resistance: 1.26619
• Second resistance: 1.26915
• Third resistance: 1.27235


