
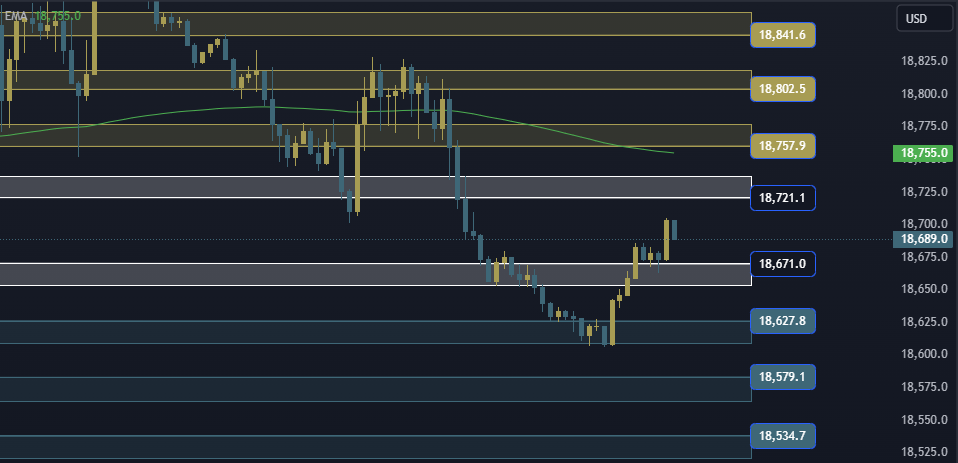
NAS100 NDX Technical Analysis The Nasdaq index is trading at the $18671/18721 area. In the event of an ascent and stability above the 18721 area, it will head to the first resistance area at 18757, and in the event of completion of the ascent, it will head to the 18802/18841 area.
NAS100 NDX Technical Analysis On the other side
In the event of a decline and stability below the 18671 area, it will head to the first support area at 18627, and in the event of a complete decline, it will head to the 18579/18534 areas.
NAS100 NDX Technical Analysis: support and resistance levels
• Third resistance: 18841
• Second resistance: 18802
• First resistance: 18757
• Trading area: 18671/18721
• First support: 18627
• Second support: 18579
• Third support: 18534


