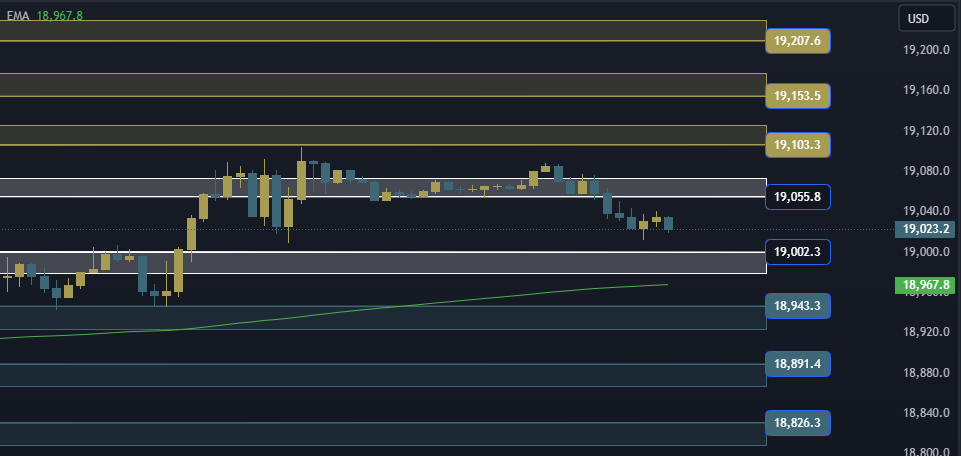
NAS100 NDX Technical Analysis The Nasdaq index is trading at the $19002/19055 area. In the event of an ascent and stability above the 19055 area, it will head to the first resistance area at 19103, and if the ascent is completed, it will head to the 19153/19207 area.
NAS100 NDX Technical Analysis On the other side
In the event of a decline and stability below the 19002 area, it will head to the first support area at 18943, and in the event of a complete decline, it will head to the 18891/18826 areas.
NAS100 NDX Technical Analysis: support and resistance levels
• Third resistance: 19207
• Second resistance: 19153
• First resistance: 19103
• Trading area: 19002/19055
• First support: 18943
• Second support: 18891
• Third support: 18826