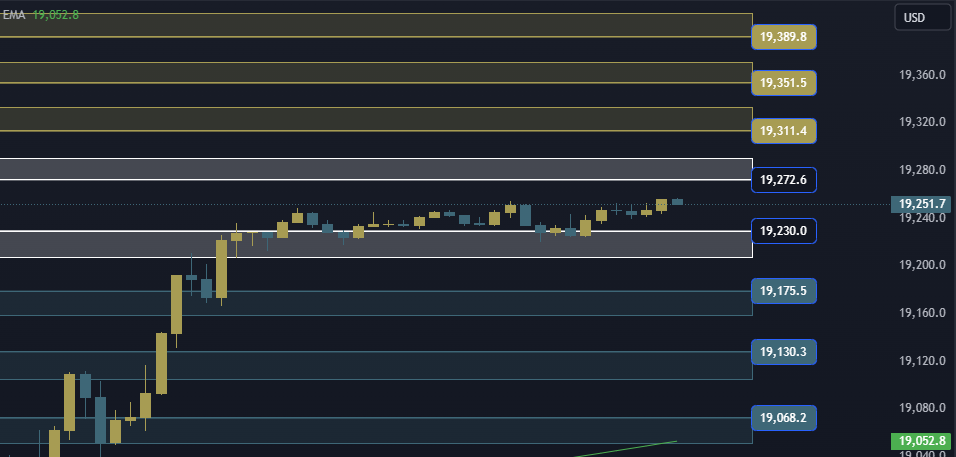
NAS100 NDX Technical Analysis The Nasdaq index is trading at the $19230/19272 area. In the event of an ascent and stability above the 19272 area, it will head to the first resistance area at 19311, and if the ascent is completed, it will head to the 19351/19389 area.
NAS100 NDX Technical Analysis On the other side
In the event of a decline and stability below the 19230 area, it will head to the first support area at 19175, and in the event of a complete decline, it will head to the 19130/19068 areas.
NAS100 NDX Technical Analysis: support and resistance levels
• Third resistance: 19389
• Second resistance: 19351
• First resistance: 19311
• Trading area: 19230/19272
• First support: 19175
• Second support: 19130
• Third support: 19068