
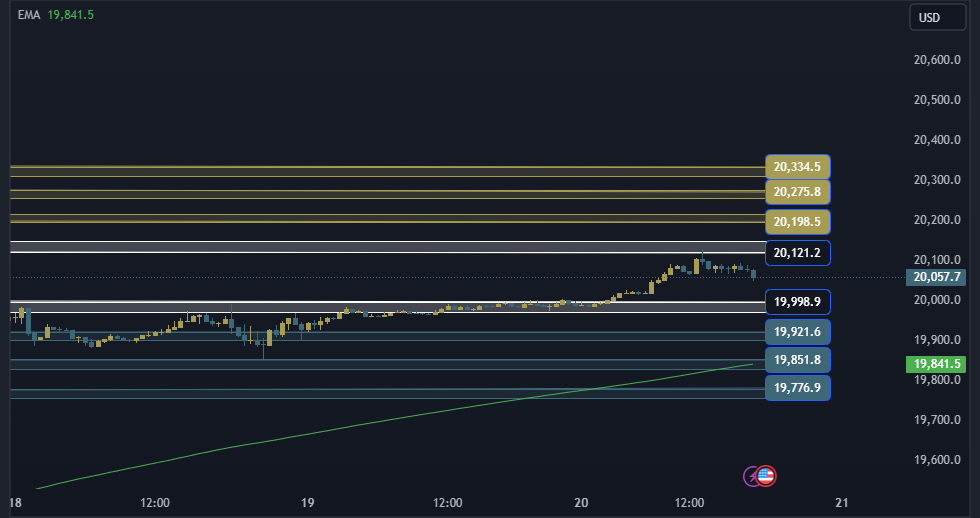
NAS100 NDX Technical Analysis, The Nasdaq index is trading at the $19,998/20121 area. In the event of an ascent and stability above the 20121 area, it will head to the first resistance area at 20198, and if the ascent is complete, it will head to the 20275/20334 areas.
NAS100 NDX Technical Analysis: On the other side
In the event of a decline and stability below the 19998 area, it will head to the first support area at 19921, and in the event of a complete decline, it will head to the 19851/19776 areas.
NAS100 NDX Technical Analysis: support and resistance levels
• Third resistance: 20334
• Second resistance: 20275
• First Resistance: 20198
• Trading area: 20121/19998
• First support: 19921
• Second support: 19851
• Third support: 19776


