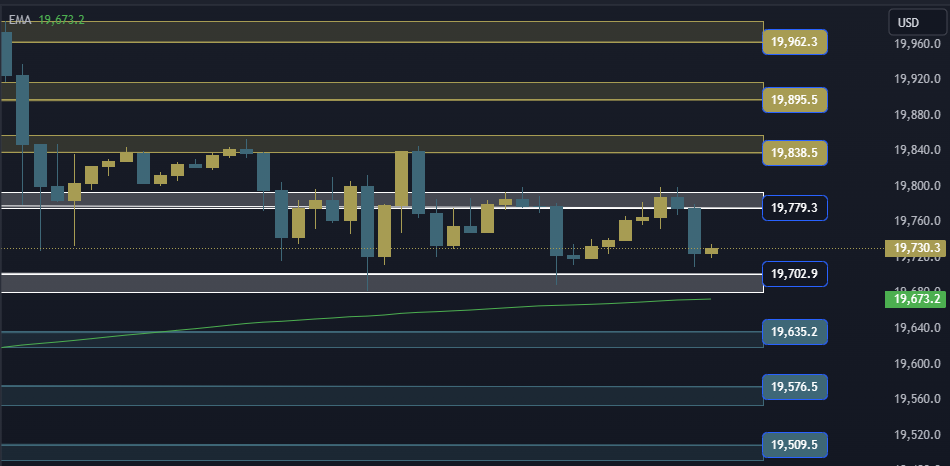
NAS100 NDX Technical Analysis is trading at the $19702/19779 area. In the event of an ascent and stability above the 19779 area, it will head to the first resistance area at 19838, and if the ascent is complete, it will head to the 19895/19962 area.
NAS100 NDX Technical Analysis On the other side
In the event of a decline and stability below the 19702 area, it will head to the first support area at 19635, and in the event of a complete decline, it will head to the 19576/19509 areas.
NAS100 NDX Technical Analysis: support and resistance levels
• The Third Resistance: 19962
• Second resistance: 19895
• First resistance: 19838
• Trading area: 19702/19779
• First support: 19635
• Second support: 19576
• Third support: 19509