
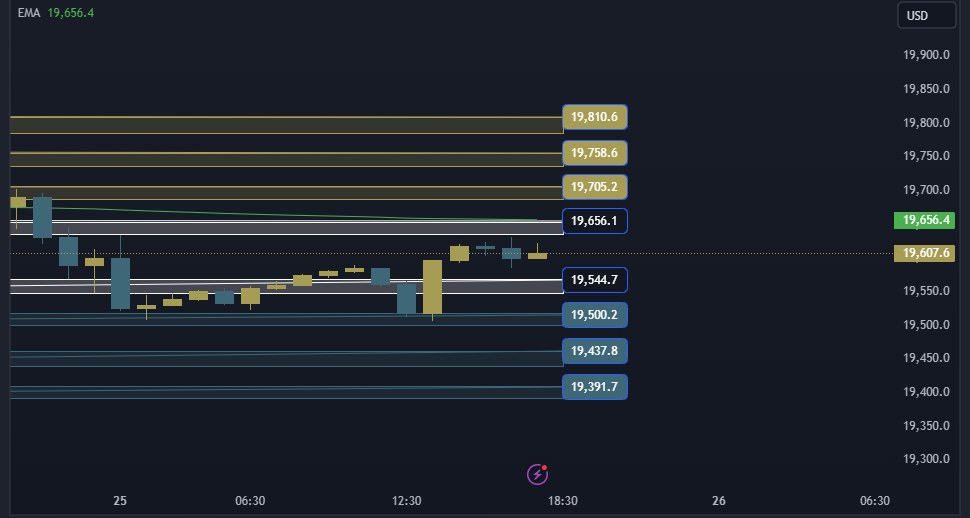
NAS100 NDX Technical Analysis is trading at the $19656/19544 area. In the event of a decline and stability below the 19544 area, it will head to the first support area at 19500, and in the event of a complete decline, it will head to the 19437/19391 area.
NAS100 NDX Technical Analysis On the other side
In the event of an ascent and stability above the 19656 area, it will head to the first resistance area at 19705, and in the event of a complete decline, it will head to the 19758/19810 areas.
NAS100 NDX Technical Analysis: support and resistance levels
• Third resistance: 19810
• Second resistance: 19758
• First resistance: 19705
• Trading area: 19656/19544
• First support: 19500
• Second support: 19437
• Third support: 19391


