
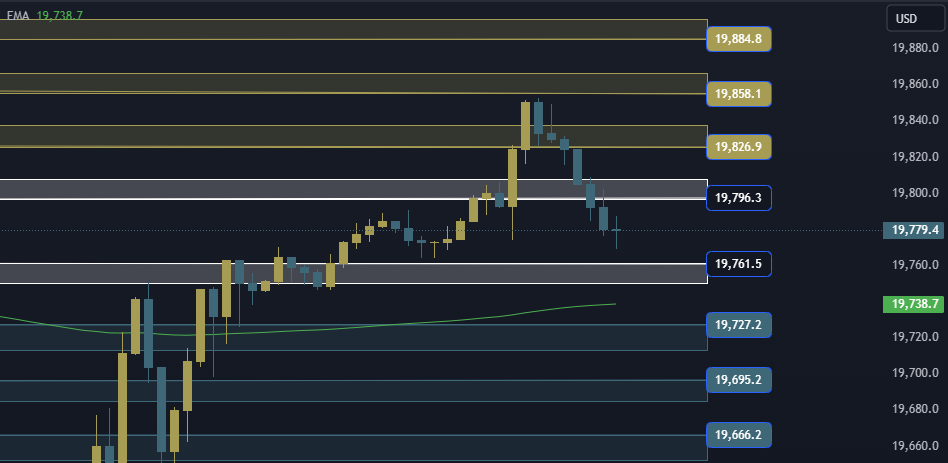
NAS100 NDX Technical Analysis is trading at the 19761/19796 area. In the event of a decline and stability below the 19796 area, it will head to the first support area at 19826, and in the event of a complete decline, it will head to the 19858/19884 area.
NAS100 NDX Technical Analysis On the other side
In the event of an ascent and stability above the 19761 area, it will head to the first resistance area at 19727, and in the event of a complete decline, it will head to the 19666/19695 areas.
NAS100 NDX Technical Analysis: support and resistance levels
• Third Resistance: 19884
• Second resistance: 19858
• First resistance: 19826
• Trading area: 19761/19796
• First support: 19727
• Second support: 19695
• Third support: 19666


