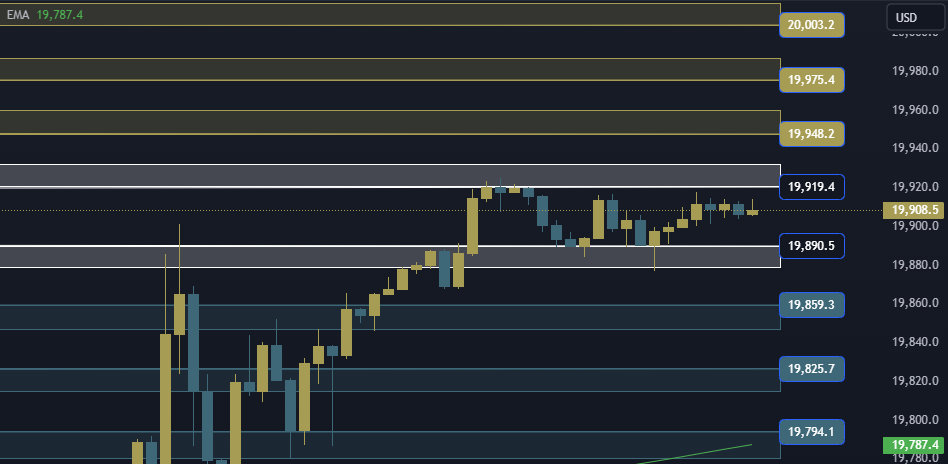
NAS100 NDX Technical Analysis is trading at the $19890/19919 area. In the event of an ascent and stability above the 19919 area, it will head to the first resistance area at 19948, and if the ascent is completed, it will head to the 19975/20003 areas.
NAS100 NDX Technical Analysis On the other side
In the event of a decline and stability below the 19890 area, it will head to the first support area at 19859, and in the event of a complete decline, it will head to the 19825/19794 areas.
NAS100 NDX Technical Analysis: support and resistance levels
• Third resistance: 20003
• The Second Resistance: 19975
• First resistance: 19948
• Trading area: 19890/19919
• First support: 19859
• Second support: 19825
• Third support: 19794