
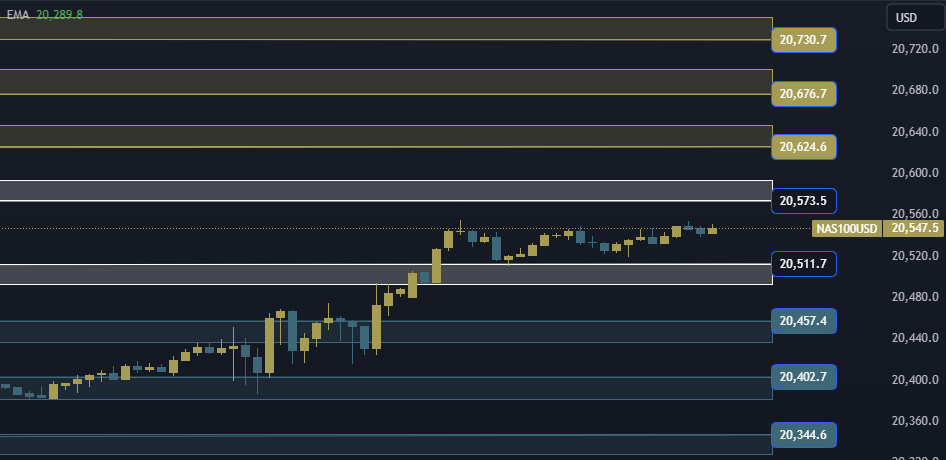
NAS100 NDX Technical Analysis is trading at the $20511/20573 area. In the event of an ascent and stability above the 20573 area, it will head to the first resistance area at 20624, and if the ascent is complete, it will head to the 20676/20730 area.
NAS100 NDX Technical Analysis On the other side
In the event of a decline and stability below the 20511 area, it will head to the first support area at 20457, and in the event of a complete decline, it will head to the 20402/20344 areas.
NAS100 NDX Technical Analysis: support and resistance levels
• Third resistance: 20730
• Second resistance: 20676
• First resistance: 20624
• Trading area: 20511/20573
• First support: 20457
• Second support: 20402
• Third support: 20,344


