NAS100 NDX Technical Analysis is trading at the $20524/20565 area. In the event of an ascent and stability above the 20565 area, it will head to the first resistance area at 20609, and if the ascent is complete, it will head to the 20650/20697 area.
NAS100 NDX Technical Analysis On the other side
In the event of a decline and stability below the 20524 area, it will head to the first support area at 20473, and in the event of a complete decline, it will head to the 20422/20368 areas.
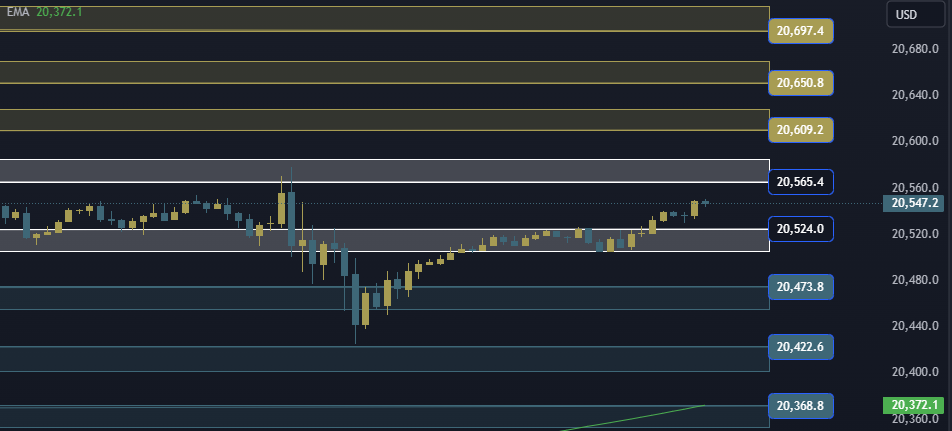
NAS100 NDX Technical Analysis: support and resistance levels
• Third resistance: 20697
• Second resistance: 20650
• First resistance: 20609
• Trading area: 20524/20565
• First support: 20473
• Second support: 20422
• Third support: 20368