
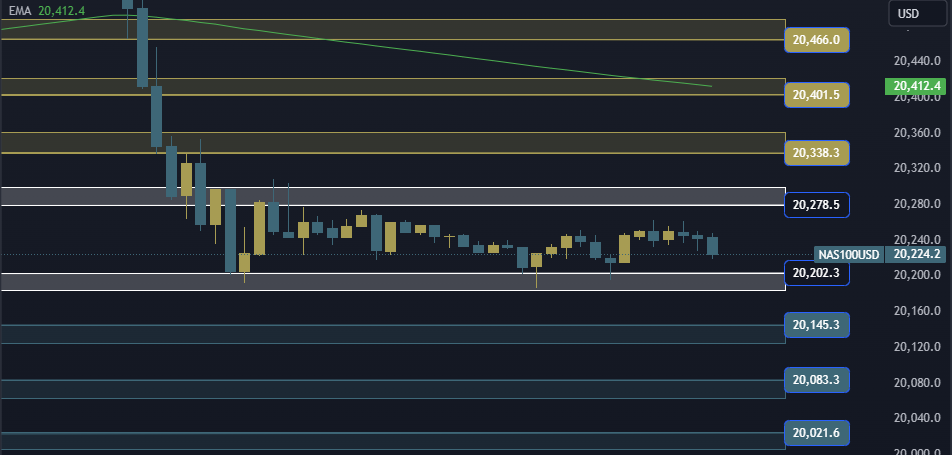
NAS100 NDX Technical Analysis is trading at the $20202/20278 area. In the event of an ascent and stability above the 20278 area, it will head to the first resistance area at 20338, and in the event of completion of the ascent, it will head to the 20401/20466 area.
NAS100 NDX Technical Analysis On the other side
In the event of a decline and stability below the 20202 area, it will head to the first support area at 20145, and in the event of a complete decline, it will head to the 20083/20021 areas.
NAS100 NDX Technical Analysis: support and resistance levels
• Third resistance: 20466
• Second resistance: 20401
• First resistance: 20338
• Trading area: 20202/20278
• First support: 20145
• Second support: 20083
• Third support: 20021


