
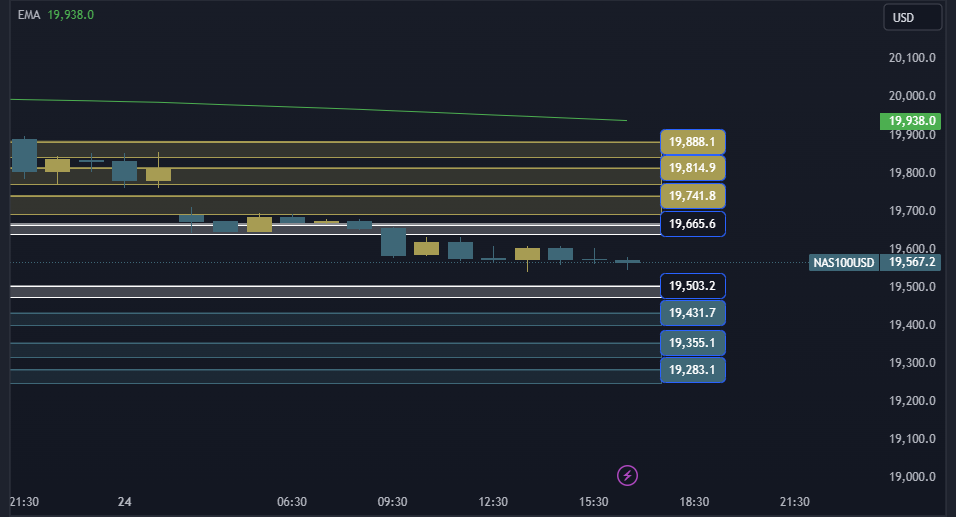
NAS100 NDX Technical Analysis is trading at the $19665/19503 area. In the event of an ascent and stability above the 19665 area, it will head to the first resistance area at 19741, and if the ascent is complete, it will head to the 19814/19888 area.
NAS100 NDX Technical Analysis On the other side
In the event of a decline and stability below the 19503 area, it will head to the first support area at 19431, and in the event of a complete decline, it will head to the 19355/19283 areas.
NAS100 NDX Technical Analysis: support and resistance levels
• Third resistance: 19888
• Second resistance: 19814
• First resistance: 19741
• Trading area: 19665/19503
• First support: 19431
• Second support: 19,355
• Third support: 19283


