
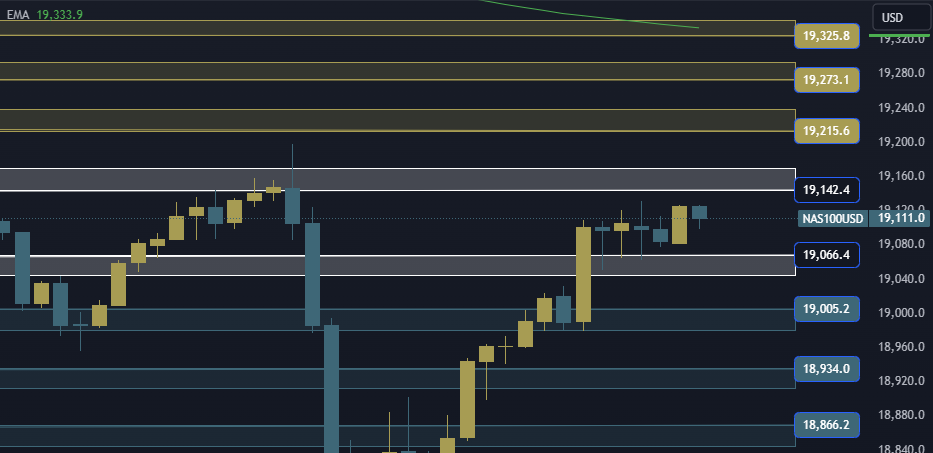
NAS100 NDX Technical Analysis is trading at the $19066/19142 area, in case of rising and stability above the $19142 area, it will head to the first resistance area at 19215 and in case of continuing the rise, it will head to the $19273/19325 areas
NAS100 NDX Technical Analysis On the other hand,
In case of falling and stability below the $19066 area, it will head to the first support area at 19005 and in case of continuing the decline, it will head to the $18934/18866 areas
NAS100 NDX Technical Analysis: Support and resistance levels
• Third resistance: 19325
• Second resistance: 19273
• First resistance: 19215
• Trading area: 19066/19142
• First support: 19005
• Second support: 18934
• Third support: 18866


