
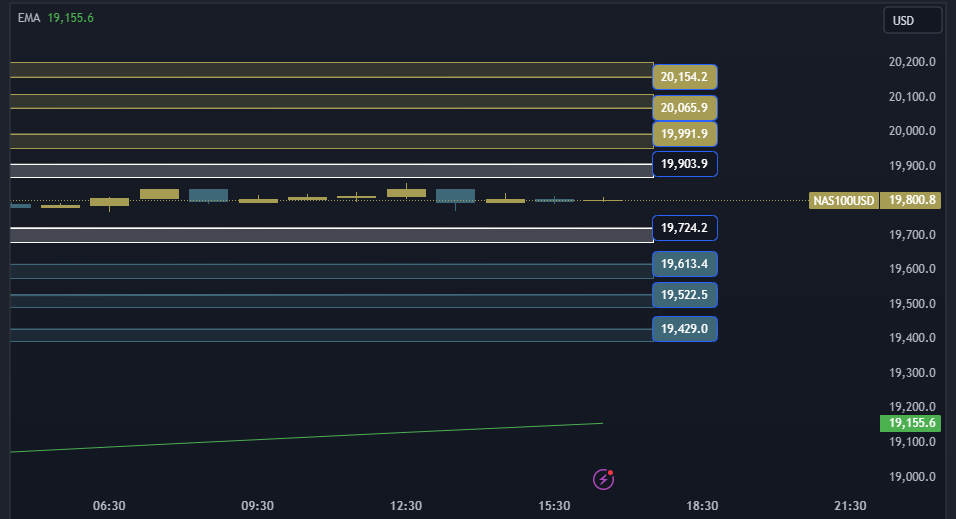
NAS100 NDX Technical Analysis is trading at the $19903/19724 area, in case of rising and stability above the $19903 area, it will head to the first resistance area at $19990 and in case of continuing the rise, it will head to the $20060/20155 areas
NAS100 NDX Technical Analysis On the other hand,
In case of falling and stability below the $19724 area, it will head to the first support area at $19613 and in case of continuing the decline, it will head to the $19522/19429 areas
NAS100 NDX Technical Analysis: Support and resistance levels
• Third Resistance: 20154
• Second Resistance: 20065
• First Resistance: 19990
• Trading Area: 19903/19724
• First Support: 19613
• Second Support: 19522
• Third Support: 19429


