
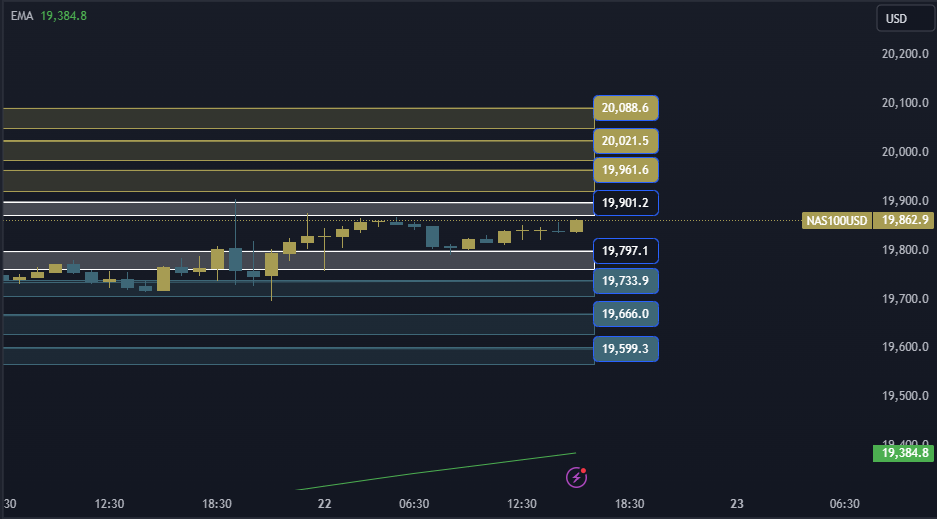
NAS100 NDX Technical Analysis is trading at the $19901/19797 area, in case of rising and stability above the $19901 area, it will head to the first resistance area at $19961 and in case of continuing the rise, and it will head to the $20021/20088 areas.
NAS100 NDX Technical Analysis On the other hand
In case of falling and stability below the $19797 area, it will head to the first support area at $19733 and in case of continuing the decline, it will head to the $19666/19599 areas.
NAS100 NDX Technical Analysis: Support and resistance levels
• Third Resistance: 20088
• Second Resistance: 20021
• First Resistance: 19961
• Trading Area: 19901/19797
• First Support: 19733
• Second Support: 19666
• Third Support: 19599


