
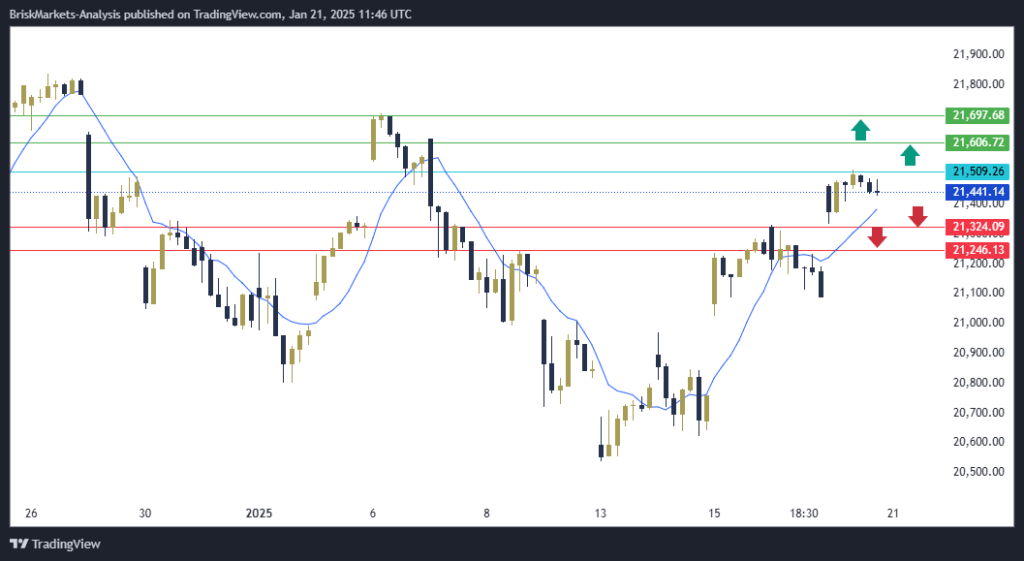
NAS100 NDX Technical Analysis Today, the Nasdaq ND100 is at $21441.14. In the event of an uptrend and stability above the 21509.26 area, it will head to the first resistance at 21606.72. In the event of a complete uptrend, it will head to the second resistance at 21697.68.
On the other hand,
in the event of a downtrend and stability below the 21509.26 area, it will head to the first support area at 21324.09 and the second support area at 21246.13.
NAS100 NDX Technical Analysis: Resistance and support levels
• Second resistance: 21697.68
• First resistance: 21606.72
• First support: 21324.09
• Second support: 21246.13


