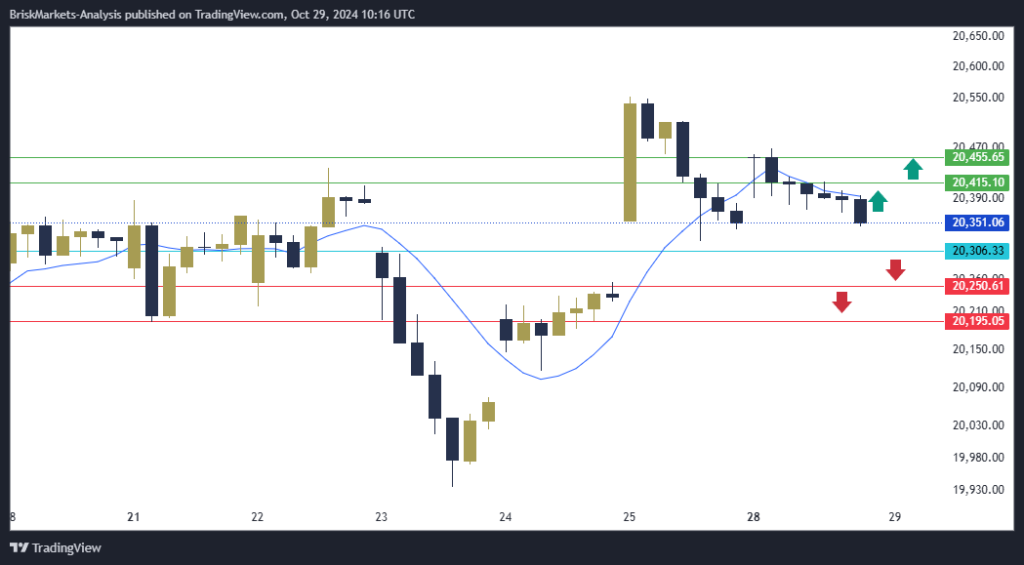
NAS100 NDX Technical Analysis today at $20351, in case of falling and stability below the 20306 area, it will head to the first support area at 20250 and in case of continuing the decline, it will head to the second support at 20195
On the other hand
In case of rising and stability above the 20306 area, it will head to the first resistance area 20415 and the second resistance area at 20455

NAS100 NDX Technical Analysis: Resistance and Support Levels
• Second Resistance: 20455
• First Resistance: 20415
• First Support: 20250
• Second Support: 20195


