NAS100 NDX Technical Analysis Today at $20287.82. If the stock rises and stabilizes above the 20323.43 area, it will head towards the first resistance area at 20374. If the stock continues to rise, it will head towards the second resistance area at 20427.11.
On the other hand,
IF the stock declines and stabilizes below the 20323.43 area, it will head towards the first support area at 20257.45 and the second support area at 20205.46.
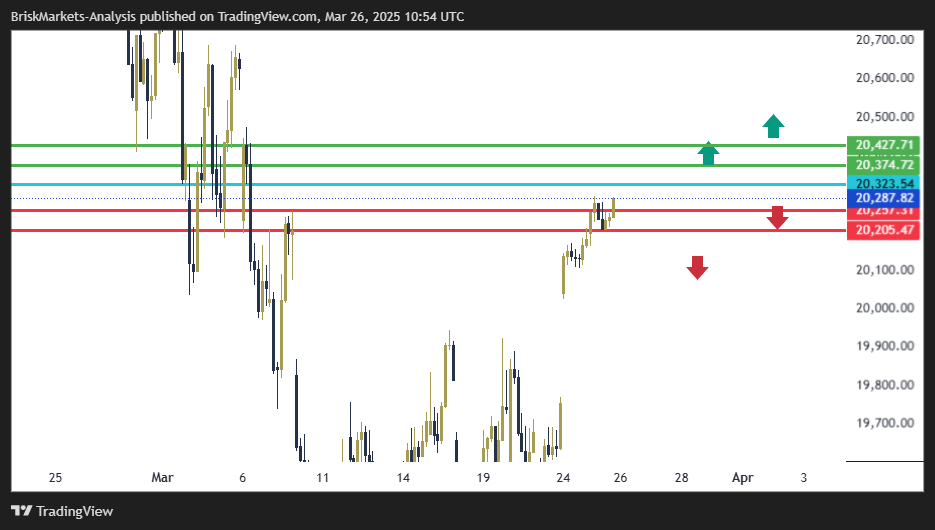
NAS100 NDX Technical Analysis: Resistance and Support Levels
• Second Resistance: 20427.71
• First Resistance: 20374.72
• First Support: 20257.31
• Second Support: 20205.47