
NZDUSD Technical Analysis: today in a bearish trend during the American session. The New Zealand dollar is trading at 0.6109, and trading appears below most of the moving average intersections. The MACD indicator also indicates a negative trend indicating the presence of selling power.
Accordingly, we can consider selling while waiting for the price of the New Zealand Dollar pair to fall at the level of 0.6092, and the target could be the 0.6059 area. It is also recommended to choose the 0.6153 area as a stop loss point to control risk.
NZDUSD Technical Analysis: On the other side
On the other hand, if the stop loss area at 0.6153 is broken, the New Zealand dollar price may head towards the 0.6184 level.
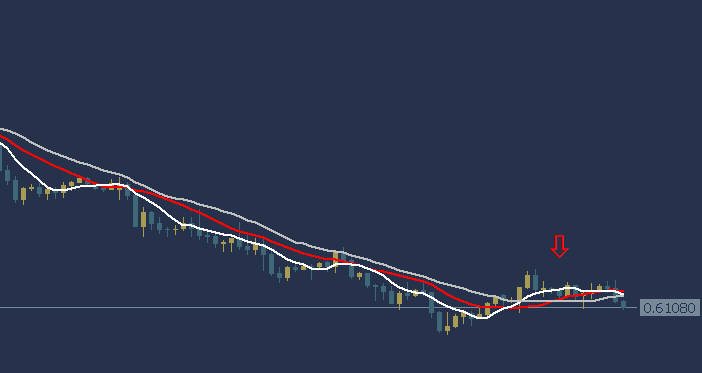
NZDUSD Technical Analysis: resistance and support levels
• Second resistance: 0.6133
• First resistance: 0.6122
• Pivot level: 0.6117
• First support: 0.6106
• Second support: 0.6101
Gold Technical Analysis: XAUUSD is trading in a bearish trend
Gold Technical Analysis, in the current American trading session, shows a bearish trend. Gold is currently trading at $2012.34 per ounce. Trading is below most moving average intersections, as can be clearly seen in the chart. For reference, the MACD indicator shows a negative trend, which indicates the emergence of selling power.
Based on this analysis, we can consider a selling opportunity while waiting for the gold price to fall to the target area of $2002.06 per ounce, and the next target may reach the $1992.97 area. It is also preferable to set the $2021.54 per ounce area as a stop-loss point, in order to contribute to effective risk management.
Gold Technical Analysis: On the other hand
On the other hand, if the stop loss area at $2021.54 per ounce is broken, this could lead to the gold price rising towards the $2031.92 per ounce level.
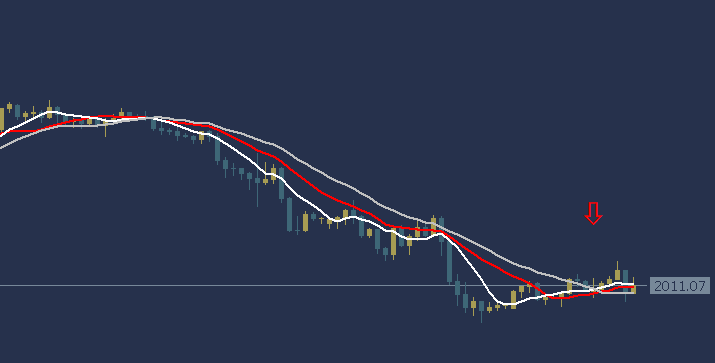
Gold Technical Analysis: resistance and support levels
Second resistance: 2019.67
First resistance: 2015.44
Pivot level: 2012.72
First support: 2008.49
Second support: 2005.77
USOIL Technical Analysis: It is trading in a general upward trend
USOIL Technical Analysis Today, we find the price of oil trading at $72.90 per barrel. Based on current technical analysis, the current trend shows an upward trend in oil prices. The strength of this trend indicates a clear rise in the price of oil, as most of the moving average intersections were trading above. In addition, the MACD indicator provides strength signals to buy.
Based on this analysis, we will wait for oil to rise to the target level of $73.46 per barrel, while choosing $74.33 as a profit-taking target. It is necessary to set the stop loss point at the $71.94 area
USOIL Technical Analysis: on the other hand
If the stop loss area at $71.94 per barrel is broken, the oil price could head towards the additional level at $71.10 per barrel.
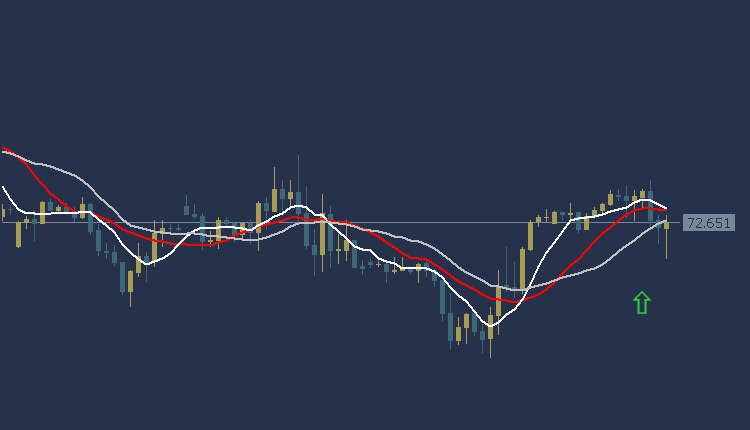
USOIL Technical Analysis: resistance and support levels:
• Second resistance: 73.12
• First resistance: 72.90
• Pivot level: 72.53
• First support: 72.31
• Second support: 71.94
Dow Jones US30 Technical Analysis: It is trading in a downward trend
Dow Jones US30 Technical Analysis Today the Dow Jones Index is trading at the $37180 area. According to technical analysis, the current trend is a downward trend in the American index prices. The price of the American index appears below most of the crossings of the moving averages, and the MACD indicator also shows negative signs
Accordingly, we expect the index to take a downward trend, so we will sell from the level of 37074, and we will also target the level of $36866 as a profit-taking target. To ensure risk control, it is recommended to set a stop loss point at the $37383 area.
Dow Jones US30 Technical Analysis: On the other hand
If the stop loss area at $37383 is broken, the additional target level at $37586 could be achieved.
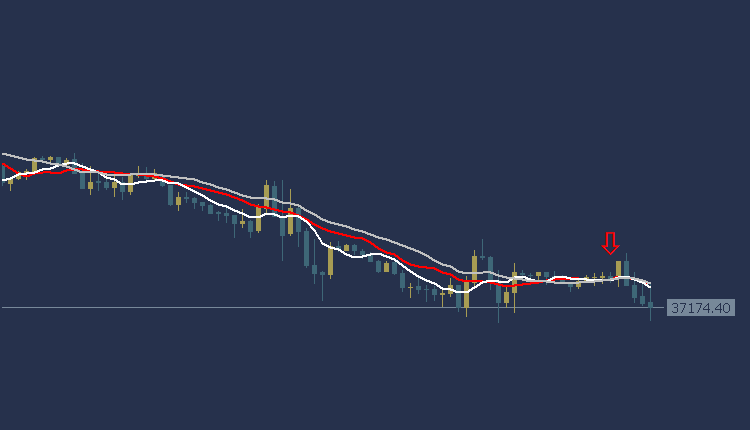
Dow Jones US30 Technical Analysis: resistance and support levels
• Second resistance: 37375.62
• Initial resistance: 37318.85
• Pivot level: 37237.78
• First support: 37181.01
• Second support: 37099.94


