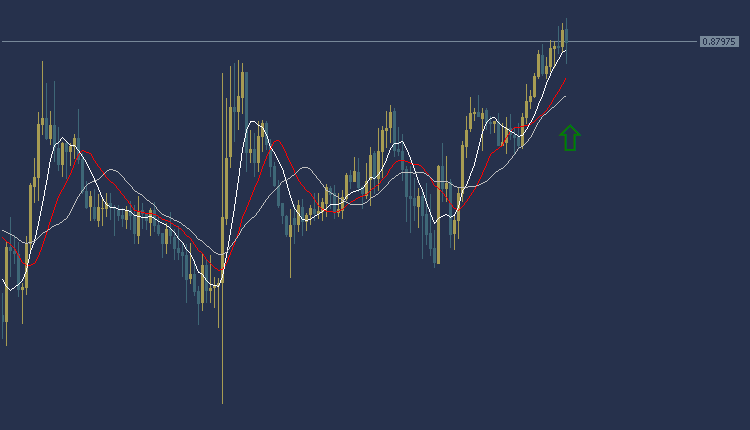
The dollar and franc are trading in an upward trend today during the European session. The dollar and franc are trading at $0.8797, and trading appears as shown in the chart above most of the moving average intersections. The MACD indicator also indicates the emergence of a positive trend indicating the presence of buying power.
Accordingly, we can make a purchase after the rise in the price of the dollar franc to the region of $0.8820, and the target could be the region of $0.8850. It is also recommended to choose the $0.8770 area as a stop loss point to control risk.
USDCHF Technical Analysis: On the other hand
On the other hand, if the support area at $0.8770 is broken, the USD/CHF price may head towards the $0.8740 level.
USDCHF Technical Analysis: resistance and support levels
• Second resistance: 0.8803
• Initial resistance: 0.8800
• Pivot: 0.8797
• First support: 0.8794
• Second support: 0.8791
EURUSD Technical Analysis: It trades in a downtrend direction
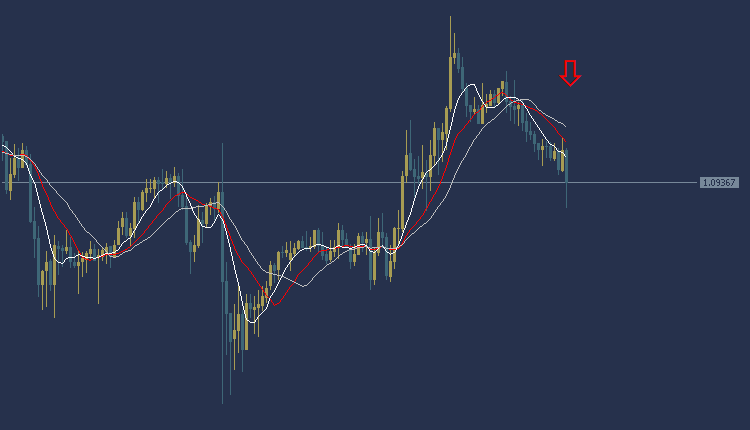
EURUSD Technical Analysis, the Euro/Dollar is trading in a bearish trend during the European session. The euro is trading at $1.0936, and as the chart shows, trading is below most of the moving average intersections. The MACD indicator also indicates a positive trend indicating a weakness in buying power.
Accordingly, we can carry out a selling operation if the Euro/Dollar price breaks at the level of $1.0920, and the target could be the $1.0890 area. It is also recommended to choose the $1.0950 area as a stop loss point to control risk.
EURUSD Technical Analysis: On the other hand
On the other hand, if the resistance area at $1.0950 is broken, the euro price may head towards the $1.0980 level.
EURUSD Technical Analysis: resistance and support
• Second resistance: 1.0944
• First resistance: 1.0941
• Pivot level: 1.0939
• First support: 1.0936
• Second support: 1.0934
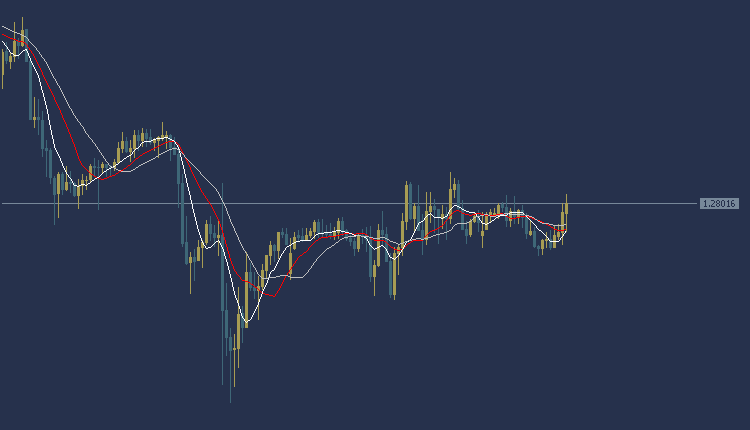
GBPUSD Technical Analysis: It trades in a sideways direction
GBPUSD Technical Analysis, the pound dollar is trades in a sideways direction today during the European session. We advise against trading until clear signals confirm the trend