
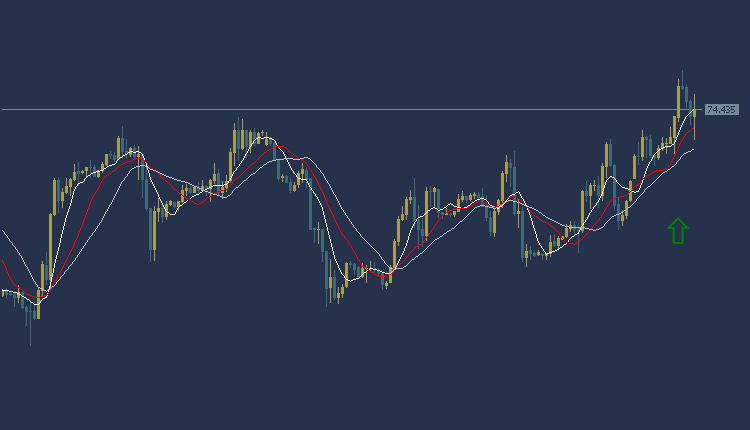
USOil Technical Analysis: Oil price today, in the global oil market, the price is trading at $71.74 per barrel. According to technical analysis, the current trend indicates an upward trend with prices trading above the moving average intersections, and the MACD indicator also shows positive signs.
Accordingly, we can buy from the current price of 71.74 and we will target $75.57 per barrel as a profit-taking target. To ensure risk control, it is recommended to set a stop loss point at the $73.13 per barrel area.
USOil Technical Analysis: On the other side
If the stop loss area at 73.13 per barrel is broken, targeting the additional support level at $72.55 per barrel could be achieved.
USOil Technical Analysis :resistance and support levels:
• Second resistance: 75.35
• First resistance: 74.99
• Pivot level: 74.80
• First support: 74.55
• Second support: 74.30
Gold Technical Analysis: bullish trading
Gold Technical Analysis:The price of gold is trading today at $2057 per ounce. Trading appears in an upward trend after the US economic data came in a negative light. The Producer’s Index (PPI), where the price of gold is trading above the intersections of the Moving Average indicators. As for the MACD indicator, it indicates… To the emergence of a strong positive trend
Accordingly, we can look to buy from the current price of $2057 per ounce, and target the $2061 per ounce area to take profits, while setting the $2045 per ounce area as a stop loss.
Gold Technical Analysis: On the other hand
On the other hand, if the stop loss area of $2045 per ounce is broken, the price may head to the $2041 per ounce area.

Gold Technical Analysis: Resistance and Support Levels:
• Second resistance: 2065.55
• First resistance: 2060.40
• Pivot level: 2057.25
• First support: 2053.90
• Second support: 2045.80
EURUSD Analysis: Weak rise within a consolidation area
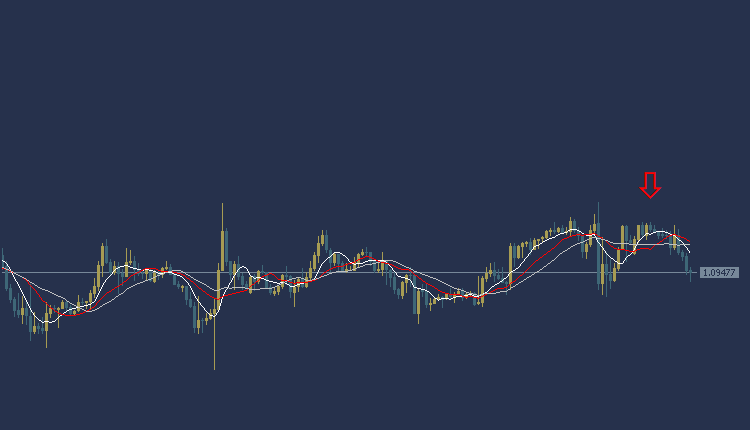
EURUSD Analysis: The Euro/Dollar is in a weak upward trend today within the sideways trend during the American session amid anticipation of the release of important American data on the Producer Price Index (PPI). The Euro/Dollar is trading at $1.0947, where prices appear to trade below most of the moving average intersections shown on the chart. The MACD indicator also indicates the emergence of a weak positive trend and, accordingly, we can look to sell from a drop to the price of $1.0937, and the target could be the $1.0924 area. It is also recommended to choose the $1.0965 area as a stop loss point to control risk.
EURUSD Analysis: On the other hand
On the other hand, if the stop loss area at $1.0965 is broken, the euro price may head towards the $1.0974 level.
EURUSD Analysis: resistance and support levels
• Second resistance: 1.0967
• First resistance: 1.0959
• Pivot level: 1.0952
• First support: 1.0935
• Second support: 1.0921
GBPUSD Technical Analysis: weak rise
GBPUSD Technical Analysis today in a weak upward trend during the American session, with anticipation of the emergence of important American indicators, the Producer Price Index (PPI). The pound is trading at $1.2726, and trading appears below most of the moving average intersections. The MACD indicator also indicates the emergence of an upward trend amid a decline in buying power. Accordingly, we can look to sell from a drop to a price of $1.2712, and the targeted target could be the $1.2693 area. It is also recommended to choose the $1.2756 area as a stop loss point to control risks.
GBPUSD Technical Analysis: on the other side
On the other hand, if the stop loss area at $1.2756 is broken, the pound price may head towards the $1.2770 level.

GBPUSD Technical Analysis: resistance and support levels
• Second resistance: 1.2746
• First resistance: 1.2735
• Pivot level: 1.2730
• First support: 1.2718
• Second support: 1.2709


